Research papers
← vista completaPublished on March 8, 2017 | http://doi.org/10.5867/medwave.2017.02.6880
Severity of illness index for surgical departments in a Cuban hospital: a revalidation study
Índice de gravedad para servicios quirúrgicos en un hospital cubano: estudio de revalidación
Abstract
INTRODUCTION In the context of the evaluation of hospital services, the incorporation of severity indices allows an essential control variable for performance comparisons in time and space through risk adjustment. The severity index for surgical services was developed in 1999 and validated as a general index for surgical services. Sixteen years later the hospital context is different in many ways and a revalidation was considered necessary to guarantee its current usefulness.
OBJECTIVE To evaluate the validity and reliability of the surgical services severity index to warrant its reasonable use under current conditions.
METHODS A descriptive study was carried out in the General Surgery service of the "Hermanos Ameijeiras" Clinical Surgical Hospital of Havana, Cuba during the second half of 2010. We reviewed the medical records of 511 patients discharged from this service. Items were the same as the original index as were their weighted values. Conceptual or construct validity, criterion validity and inter-rater reliability as well as internal consistency of the proposed index were evaluated.
RESULTS Construct validity was expressed as a significant association between the value of the severity index for surgical services and discharge status. A significant association was also found, although weak, with length of hospital stay. Criterion validity was demonstrated through the correlations between the severity index for surgical services and other similar indices. Regarding criterion validity, the Horn index showed a correlation of 0.722 (95% CI: 0.677-0.761) with our index. With the POSSUM score, correlation was 0.454 (95% CI: 0.388-0.514) with mortality risk and 0.539 (95% CI: 0.462-0.607) with morbidity risk. Internal consistency yielded a standardized Cronbach's alpha of 0.8; inter-rater reliability resulted in a reliability coefficient of 0.98 for the quantitative index and a weighted global Kappa coefficient of 0.87 for the ordinal surgical index of severity for surgical services (IGQ).
CONCLUSIONS The validity and reliability of the proposed index was satisfactory in all aspects evaluated. The surgical services severity index may be used in the original context and is easily adaptable to other contexts as well.
Introduction
Health care outcomes (mortality, complications, readmissions, and others) comprise, together with process and structure indicators, the pillars of health services performance evaluation [1],[2]. Most of the time this evaluation involves some kind of comparison between services or between different times. However, comparisons through outcome indicators should take into account the characteristics of the patients they include, in particular those possibly related to the outcome under evaluation. This means controlling variables that are potentially influential in the results and are not subject to direct evaluation, a procedure known as "risk adjustment" [3],[4].
The need for risk adjustment was first noticed in 1863 when Florence Nightingale called London hospitals dangerous, based on mortality data published at the time. There were abysmal differences between the mortality of hospitals in London and that of rural hospitals [5]. F. Nightingale's perception turned out to be a fallacy, because (among other causes) the comparison was not "risk-adjusted". Today, it is a widely explored subject, as stated in the book “Risk Adjustment for Measuring Healthcare Outcomes” published for the first time in 1994, already in its fourth edition [6], and in numerous subsequent articles [7],[8].
Risk adjustment is a must that extends to any comparison between health services of any level (wards, hospitals, specialty services), with the intention of appraising performance through outcome indicators such as mortality, morbidity or length of stay. Numerous risk adjustment systems have been developed which can be classified according to different axes [4]. One axis distinguishes those constructed on the basis of panels of experts giving rise to diagnostic clusters - which conform strata allowing stratified comparisons - from those based on patient characteristics, which can be incorporated into regression functions where outcome variables are the dependent variables. Among the first, Diagnostic Related Groups and Disease Staging are commercial systems, particularly used for calculating health care payments [9],[10].
Another form of classification distinguishes those that apply to specific diseases or procedures from those considered generic because they are applied to a health service as a whole. In health services performance assessment, hospitals in particular, forms of risk adjustment are needed that allow global comparisons in time and space independent of groups conformed by commercial systems such as those mentioned above. The most helpful are combinations of patient characteristics and their disease features associated with the risk of certain outcomes and are usually included in the concept of "severity of illness" [11],[12].
Multiple severity of illness indexes have been proposed for different services or specialties, or even for certain diseases. They can be useful in medical care (as prognostic indicators), but they are also used for risk adjustment. In intensive care units, for example, we highlight the Acute Physiology and Chronic Health Evaluation (APACHE) system and other similar ones such as Mortality Prediction Model (MPM) and The Simplified Acute Physiology Score (SAPS) [13].
Severity of illness indexes have been developed at different latitudes for performing, in some way, an adjustment for risk. However, there are very few severity indexes for general application or a wide range of hospital departments. One of the more general scales was proposed by Horn and collaborators in 1983 and called Severity of Illness Index [14],[15]. This index contains seven dimensions of medical care, each of which is assessed in four levels from the lowest level (level 1) to the most serious (level 4). It is appropriate for hospitalized patients of any clinical, surgical or intensive care service. It allows forming groups of patients that may be heterogeneous in diagnosis, but homogeneous in the consumption of hospital resources. However, it seems, it was little used; its main limitation is the need for training of appraisers to achieve acceptable reliability.
But risk adjustment is not only necessary for administrative hospital work, it is also a need for any comparison or evaluation made through outcomes. Hall and colleagues in Surgery extensively review the use of risk adjustment in all observational research particularly that made with clinical registries [16]. Even in clinical trials, where randomization presumably avoids any difference between groups, risk adjustment may be important if more informative effect sizes are to be contemplated and to account for differences among patients within groups.
As already outlined, by joining in a single variable the information of those that make up the severity level or "risk" of having a certain result, severity of illness indexes are the most used mediators for the need of risk adjustment in comparisons. In addition to the aforementioned and perhaps the first “Severity of Illness Index” proposed by Horn et al. in 1983, others have emerged thereafter [17],[18].
An index of this type, which may also be considered generic, is the Physiological and Operative Severity Score for the enUmeration of Mortality and Morbidity (POSSUM), developed in 1991 and specifically aimed at surgical patients. It has been widely used in recent years to predict mortality and morbidity in different and varied surgical processes, besides being a useful tool for risk adjustment in comparing hospitals, services or even surgeons [19].
In general, the development of these indexes is based on the methodology known for this purpose, followed, as necessary, by the corresponding validation process. The development entails at least a process for item identification, one for weighting the items and another for establishing the final score. The subsequent process of validation is unavoidable, since all the previous steps imply a certain degree of subjectivity and there are no gold standards. However, it is only natural that in the course of time the circumstances and conditions under which a certain index or scale of this type was developed, and even validated, undergo changes that may interfere with its validity. Therefore, revalidations are the best way to demonstrate the stability of the index and its possible permanence as a valid indicator of the patient's severity during hospitalization.
In order to use severity-adjusted outcome indicators for inter-service and temporal comparisons, in the Hermanos Ameijeiras Hospital in Havana, two severity of illness indexes were developed and validated in the 1990s: one for clinical services (excluding Psychiatry) and one for surgical services [20],[21]. The utility of these indices was afterwards evaluated for length of stay adjustment and an indicator of inefficiencies in hospital care development [22]. These indexes, after more than a decade of their appearance, had not been subject to new validations until 2013 when validity and reliability of the Severity Index for Clinical Services was assessed in the Rheumatology Department of the hospital [23].
The index for surgical services is calculated with data related to the patient, the surgical procedure he or she underwent and complications arising during his or her hospitalization. As already mentioned, it is an index to perform risk adjustment in a posteriori comparisons, that is, after the hospitalization is completed. The index must account for the severity of the patient during his or her past hospitalization.
This severity of illness index was developed in 1999 and validated as a general index for surgical services. Sixteen years later, the context of surgical services at the hospital had changed in different ways: surgical teams, organization, infrastructure and available technology. Therefore, revalidation was considered appropriate.
We report herein the results of the study aimed to reassess the validity and reliability of the severity of illness index for surgical services in the general surgery service of this hospital, allowing its reasonable use in the current conditions of the hospital and endorsing its generalization to other hospitals in Cuba and other countries.
Methods
A descriptive study was carried out in the general surgery service of Hospital Hermanos Ameijeiras from July to December 2010.
Clinical records of all patients discharged from the general surgery service in this period constituted the sample. If a patient had more than one discharge, only the data of the latter were retrieved. Medical records of foreign patients, and of those who did not undergo a surgical procedure, were excluded. Clinical charts were obtained from the medical registries department. Data extraction was done by two of the researchers in conjunction, doubts were consulted with the author specialized in general surgery.
Description of the severity of illness index for surgical services
The index consists of 15 components or items. Each item is scored according to certain criteria and then weighted to obtain the final score. Table 1 shows the configuration of the index.
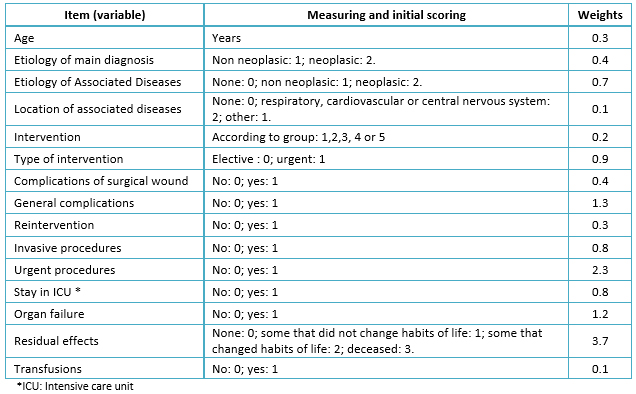 Full size
 Meaning of variables considered in the index
The main diagnosis is that morbid condition, defined after study, which caused the admission of the patient to the hospital.
Other morbid conditions independent of the main diagnosis and its complications are classified as associated diseases.
The intervention was considered in five groups according to their complexity from the most complex (group I) to the least complex (group V). These groups were proposed by the surgeon specialist with 30 years of experience, co-author of this work. Examples of interventions included in each group are shown in the original article [21].
Complications of the intervention are all unfavorable events that may occur and are related to the surgical procedure performed. Complications related to the wound include hematomas, dehiscences, bleeding, serous secretion, wound sepsis, subcutaneous emphysema, fistulas, and edema among others. General complications include urinary retention, fever, phlebitis, urinary sepsis, nausea and/or vomiting, abdominal distension, diarrhea, intestinal obstruction, hemoglobin decrease, jaundice, paralytic ileus, pneumonia, empyema, hydroelectrolytic or acid-base imbalance, generalized sepsis, heart rhythm disorders, septic shock, pulmonary thromboembolism, acute myocardial infarction, digestive bleeding, and others.
Invasive diagnostic and therapeutic procedures include those that may be harmful to the patient, such as radiation therapy, endoscopy, cardiac catheterization, respiratory therapy, gastrointestinal intubation, intravenous therapy requiring constant monitoring to prevent complications, among others. It excludes the intervention and procedures directly related to the surgical act.
Urgent procedures include those indicated on an emergency basis, in order to keep the patient alive (excluding intervention); for example cardiac resuscitation, placement of Sengstaken-Blakemore tube to contain digestive bleeding, etcetera.
An organ failure was considered when the clinical history reflected diagnosis of failure of an organ established by specialists of the intensive care unit. It was also considered when it was possible to identify dysfunction in at least one of the main organs of the economy, according to the criteria followed by the intensive care unit of the hospital. These criteria are as follows:
- Hepatic: bilirubin higher than 51 moles per liter or three milligrams per deciliter in the absence of hemolysis. Alanine aminotransferase (ALAT) higher than 100 units per liter.
- Cardiac: heart rate under 50 beats per minute; ventricular tachycardia / fibrillation; heart attack; acute myocardial infarction.
- Renal: serum creatinine higher than 280 moles per liter or 3.5 milligrams per deciliter. Need for dialysis/ultrafiltration.
- Respiratory: respiratory rate less than 5 or higher than 50 breaths per minute. Mechanical ventilation for three or more days, fractional percentage of inspired oxygen less than 0.4 or positive pressure at the end of expiration less than 5 millimeters of mercury.
- Neurological: Glasgow scale in the absence of sedation less than six.
- Digestive: presence of stress ulcers requiring transfusion of more than two units of blood in 24 hours; non-lithiasic cholecystitis, necrotizing enterocolitis; bowel perforation.
- Hematologic: hematocrit less than 20%, leukocyte count less than 0.3x10⁹ per liter, platelet count less than 50x109 per liter.
Residual effects refer to sequelae expected to be maintained after the normal wound healing period in terms of symptoms, signs, radiological or laboratory evidence, as well as functional limitations. Cases in which there is no sequelae of the disease after the operation, such as simple thymectomy, were included in category “none” (value 0). The second category (value 1) included cases in which the operation left some sequels that did not imply changes in the life habits of the patient, for example breast quadrantectomy. The third category (value 2) refers to larger sequelae that lead to changes in life habits, for example a subtotal gastrectomy. Deceased patients had a value of 3 in this variable.
The index also considers whether the patient had to be transferred to the intensive care unit at any time during the stay or if it was necessary to transfuse blood.
The final score takes values between 5.1 for a person with 15 years and the rest of the variables in the minimum possible value and 57.6 for a person of 90 years who dies as a result of an operation with all variables in their higher or more complex value.
The index was evaluated in two versions. First, in its quantitative form (quantitative severity index for surgical services) and then in three categories, from lowest to highest severity (ordinal severity index for surgical services). To obtain the latter, the empirical percentiles of this variable were calculated and each patient was classified into one of the three categories given by percentiles:
- Less than the 25th percentile.
- Between the 25th and 75th percentile
- Greater than the 75th percentile.
To evaluate the psychometric characteristics of the proposed index (as described below), data were also taken from the medical history to assess in each patient the severity level according to two scales described in the literature and introduced below.
1. Adaptation of Severity of Illness Index proposed by Horn
The basic information was collected according to the table proposed by their authors [24]. Two adaptations were made to the way the original score is calculated. First, the “patient dependence from the hospital staff and facilities” variable was eliminated, since the clinical records do not display sufficient information to evaluate this point. The overall score of the index was then the sum of the points obtained in the six variables after evaluating each aspect with a scale between 1 and 4 points according to its authors. Therefore, the value of the disease severity index oscillated between 6 and 24 points (from lowest to highest severity).
2. Evaluation of the Physiological and Operative Severity Score for the enUmeration of Mortality and Morbidity (POSSUM)
In this scale, two types of scores are considered: one physiological, with 12 factors, and the other with surgical severity, using six factors. The risk of mortality and morbidity are then estimated through a logistic regression equation. Both severity indicators are used by this system. Details are described in the original and subsequent articles [25].
Evaluation of the severity index for surgical services psychometric properties, statistical analysis
Construct validity
It was first evaluated by measuring the degree of association between the severity index for surgical services and two indicators hypothetically related to severity: status at discharge (live or deceased) and hospital stay. The association between the quantitative severity index and discharge status was assessed by comparing the means of the index between live and deceased, using the Mann-Whitney U-test for independent samples, since there were only 27 deaths (hindering parametric comparisons).
The association between the ordinal index and discharge status was evaluated with the Chi-squared statistic (χ2) and the association coefficient for ordinal variables τ C. The relationship between the quantitative severity index for surgical services and hospital length of stay (in patients discharged alive), was evaluated using the Pearson correlation coefficient.
Criterion validity
It was performed by assessing the relationship between the quantitative severity index and two other indicators of severity for hospitalized patients, Horn's severity of illness score and POSSUM, through Pearson's correlation coefficient. Both indexes were mentioned before.
Internal consistency
For internal consistency evaluation, the quantitative index was used with its respective items and Cronbach's α coefficients were calculated. A general Cronbach's α (with and without item standardization) was calculated and the one obtained after eliminating each of the items. We also calculated the inter-item and the item-total correlation coefficients together with the determination coefficient (R2) arising from using each item as a dependent variable, and the rest of the items as independent. Both procedures provided information on the degree of correlation between each item and the rest.
Inter-rater agreement
Fifty clinical records were chosen at random among the 511 included in the study. This is a sufficient number of observations for obtaining 90 or 95% confidence intervals for the intraclass correlation coefficient, with absolute precision between 0.2 and 0.5 assuming previous coefficient values of 0.9, and 0.8 for Kappa coefficient (κ) [26],[27]. Three independent evaluators (authors) obtained the severity index for surgical services in each record. With these data the intraclass correlation or reliability coefficient was calculated with the quantitative severity index and the Kappa coefficient (κ), with the ordinal severity index. We obtained the κ coefficient weighted for more than two raters and more than two categories, and the κ for each level. Statistical significance was calculated for the global κ and for each of the κ`s by level. Confidence intervals were also obtained for these coefficients.
Ethical aspects
The study was approved by the Scientific Council of the Hermanos Ameijeiras Hospital, where the study was performed, after presenting the project in a regular meeting of this council. Confidentiality of the information was guaranteed by eliminating all antecedents that could identify the patients, once the data had been obtained from the records, and the original database created and validated.
Results
Of a total of 574 discharges from the service in that period, 37 were discarded repeated patients (data from the last discharge was retrieved for these patients); 15 were not in the archive; three belonged to foreign patients and eight were patients who did not undergo a surgical procedure. No medical record had missing data thus 511 patients were enrolled. Table 2 shows the description of the main characteristics of the patients included.
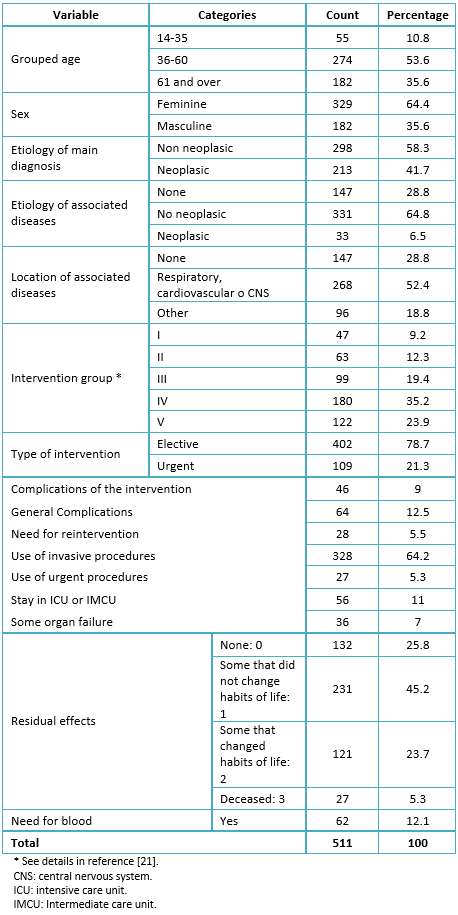 Full size
 The distribution of the quantitative severity index was not far from Normal. Kolmogorov Smirnov test did not reject the normality hypothesis with mean 23.08 and standard deviation 7.036 (p = 0.684). The empirical 25th, 50th and 75th percentiles were 17.9, 23.0 and 27.3 respectively. These percentiles were the limits for the ordinal index of three categories.
Construct validity
The mean (± standard deviation) of the severity index for patients discharged alive was 22.3 ± 6.3, while for the deceased patients it was 6.5 ± 6.0 (p <0.0001). Ninety five percent confidence interval for the difference was 11.7 - 16.6.
Figure 1 displays the relationship between the quantitative severity index and hospital length of stay in the discharged alive patients. The Pearson correlation coefficient (r) was relatively low (0.32) but significantly different from 0 (p <0.001).
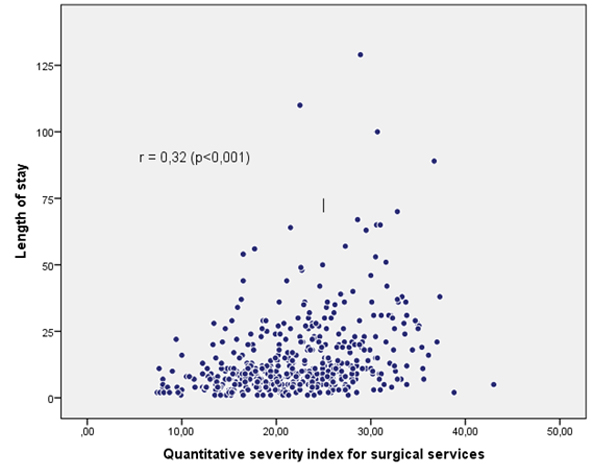 Full size
 The association between the index in its ordinal version and discharge status is shown in Table 3. Only 27 patients died, 25 (92.6%) classified at the highest severity level for the ordinal severity index. The association was significant (p <0.001) and the value of the coefficient τ C (0.15) indicates association.
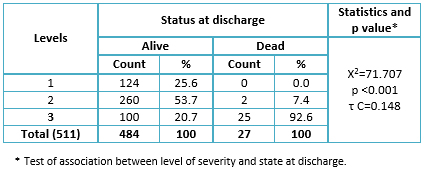 Full size
 Criterion validity
The association between the severity index for surgical services and the Horn severity index is shown in Figure 2. Pearson correlation coefficient was 0.722 (95% confidence interval: 0.677-0.761) indicating strong association.
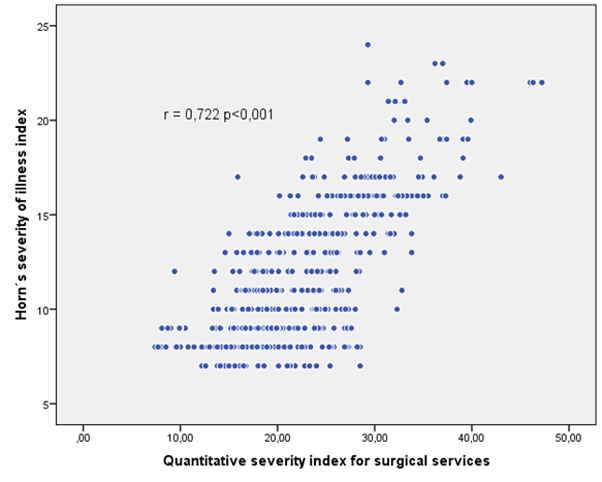 Full size
 Likewise, the correlation between the proposed index and the risk of death obtained with POSSUM was 0.454 (95% confidence interval: 0.388-0.514). With the risk of morbidity according to this same system, the correlation is 0.539 (95% confidence interval: 0.462-0.607).
Internal consistency
Regarding internal consistency, Cronbach's α coefficient was 0.153, which with the standardized items rose to 0.791. The highest correlation between items (r=0.79) was observed between the use of urgent procedures and the occurrence of organ failure. "Etiology of associated diseases" and "location of associated diseases" showed a 0.77 correlation coefficient. A correlation coefficient between 0.6 and 0.7, was found for: stay in intensive care unit and appearance of general complications (0.662); occurrence of organ failure and appearance of general complications (0.635); stay in intensive care unit and need for some urgent procedure (0.617); occurrence of organ failure and stay in an intensive care unit (0.677).
Other elements of internal consistency are shown in Table 4. The elimination of any of the items except age would cause a significant decrease in Cronbach's α, a fact that emphasizes the importance of the items in terms of internal consistency.
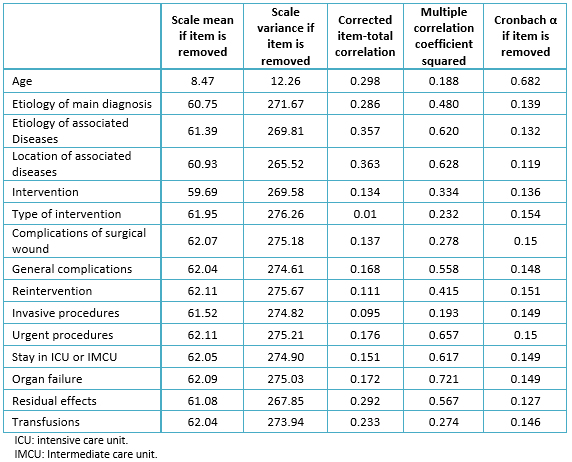 Full size
 Inter-rater agreement (reliability)
The coefficient of reliability (R) was 0.98 indicating 98% of the total variance of the scores given by raters was due to the patients.
With the ordinal severity index we obtained the weighted global κ coefficient, which measures the agreement between appraisers. We obtained a global weighted κ coefficient of 0.87, category 3 had the highest coefficient (0.88) and the lowest was 0.63 for category 2. All were significantly different from zero (p <0.05) (Table 5); however, confidence intervals indicate that κ for categories 1 and 2 could take values smaller than 0.5.
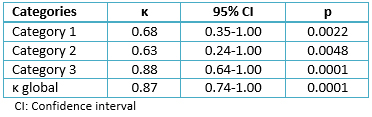 Full size
 Discussion
In the evaluation of hospital performance through outcome indicators, severity of illness indexes are especially useful. These indexes encompass and quantify the severity of each patient during the hospitalization period. So, it is possible to distinguish the part of the outcomes due to the quality of care received from the one due to the patient characteristics and his or her illness. The present report presents the results of the reassessment of validity and reliability of a general severity index for surgical services, developed and first validated in the 1990s, at Hermanos Ameijeiras Hospital in Havana, Cuba.
The evaluation of construct validity involves complicated aspects. One must find features indirectly related to what the index tries to measure, as length of stay and discharge status. As for the status at discharge it can be reasoned that, if the proposed index actually measures the level of severity of a surgical patient, then the index, as a variable, should show higher levels for the deceased than for the discharged alive patients. Also supposedly, the index should be positively associated with the length of stay in discharged alive patients. Given the results of the study, construct validity is considered acceptable, as it corroborates our hypotheses in both the ordinal and quantitative versions. We found a similar situation in previous studies performed by us with a similar severity index for clinical services [20]. The relationship of severity indexes with mortality is frequently assessed, in particular their ability to predict mortality in surgical patients. It is a relation that confirms construct validity of an index having also a possible utility for prognostic purposes. The POSSUM scoring system for example, has been evaluated as predictor of post-surgical mortality in several studies [26],[27],[28]. The presented index is conceived for use in risk adjustment for performance evaluations. Its use as a prognostic index after a surgical intervention, would entail adjustments that should be evaluated in future studies.
Regarding length of stay, although the association was significant, Pearson's correlation coefficient was relatively low. Although a direct association between the severity index for surgical services and length of stay was expected, it was not intended to be high. It has been shown that length of stay does not only depend on the clinical and demographic characteristics of the patients, there are other factors that can influence the time of permanence of a patient in the hospital as has been emphasized and demonstrated in different studies [29],[30],[31]. Factors such as those accounting for the socioeconomic status or indicating the use of hospital services have been related to length of stay. In the original study, where this index was first proposed, the correlation between length of stay and severity was even lower. In a study evaluating validity of the Computerized Severity Index (CSI), an indicator derived from the Horn Index, it was found that 54% of the length of stay could be explained by severity in conjunction with Diagnostic Related Groups [32]. Other authors, find that severity of illness, even in conjunction with other variables, is able to account for less than 30% of length of stay [33].
Criterion validity is usually easy to evaluate when there is another measure that can be considered a pattern or gold standard. In our case we used two scales to evaluate criterion validity: the Severity of Illness Index proposed by Horn et al., and the Physiological and Operative Severity Score for the enUmeration of Mortality and Morbidity. The Horn scale showed acceptable validity and reliability in the validation study performed after its onset. The Physiological and Operative Severity Score for the enUmeration of Mortality and Morbidity has been validated in several studies, mainly demonstrating its ability to predict mortality or morbidity in post-surgical patients and to perform risk adjustment in the evaluation of results in the area of surgery as well [34].
The high correlation between the Horn Severity of Illness Index and the quantitative severity index was similar to that found in the first validation. This high correlation could undoubtedly be a consequence of having used the first as a basis for obtaining the weights, although the construction was done with a group of clinical records different from the validation one and in an earlier period of time. However, achieving an indicator that has a high correlation with the Horn Index highlights the validity of the proposed index, especially if, as here, the new indicator is easier to apply.
With the risk of mortality and morbidity obtained through the Physiological and Operative Severity Score for the enUmeration of Mortality and Morbidity our index showed a significant but not high correlation (about 0.5). In general, criterion validity (concurrent, as in this case), only shows that the new instrument is not far from what, with respect to the concept being measured, have reached other already consolidated instruments. The Physiological and Operative Severity Score for the enUmeration of Mortality and Morbidity includes 14 physiological variables (not always measured in a surgical patient) and six variables that account for the severity of the intervention. It is undoubtedly a more complex scale than the one proposed in this paper. In these terms, the associations or correlations reached by the severity index for surgical services may be considered acceptable. In scale validation, criterion validity is not always high For example, a recent systematic review evaluating properties of endoscopic scales that measure Crohn's disease activity found that correlation coefficients for criterion validity ranged from 0.4 to 0.6 [35].
In the field of reliability, inter-rater agreement is the most desirable feature for the expected usefulness of the proposed index. The appropriate index for measuring agreement between judges (or raters) for continuous variables is the intraclass correlation or reliability coefficient (R). When an attribute is evaluated in different subjects using a quantitative scale applied by more than one observer, this coefficient indicates which part of the total variance of the observations obtained is due to the subjects. A high coefficient indicates that the variation between evaluators and other sources is small and, therefore, the measurement scale is reliable.
Lee et al., for example, suggest that for two measurements to be considered interchangeable, the estimated 95% confidence interval for this coefficient should have a lower limit above 0.75 [36]. However Müller and Büttner criticize this rule, arguing that the intraclass correlation coefficient depends on the variance of the population and has no real meaning [37]. Although an intraclass correlation coefficient greater than 0.9 as found here seems to be acceptable, or perhaps very acceptable, most of the texts or documents dealing with this coefficient do not express the value it should have to be considered as such. Probably because this coefficient takes different forms and because a threshold value that is independent of the context in which it was obtained is impossible and perhaps undesirable.
Another coefficient useful to evaluate concordance between judges or evaluators is Cohen's κ coefficient, proposed in 1960 and then enhanced by Fleiss and Cohen [38]. This coefficient is designed for categorical variables with two or more categories and has been widely used in the health field. In our case, we are proposing two versions of the severity index for surgical services, one of which contemplates three ordinal categories. For this version our global κ was 0.87 (95% confidence interval: 0.74-1.00). Landis and Koch, seconded by Fleiss suggest that values above 0.7 can be considered very acceptable [39]. Regarding agreement by categories, the relevant issue is that there was a greater concordance for category 3. It is possible that patients in more serious levels are easier to classify and this is reflected in the agreement between evaluators. On the other hand, it is possible that, most of the time, we need not to make mistakes classifying the most severe patients, and this feature would be a strength of the proposed index. Confidence intervals indicate that while the global κ can only take values greater than 0.7 (with 95% confidence), the agreement for categories 1 and 2 could be really low.
The internal consistency of our severity index for surgical services would be considered acceptable if we take into account that Bland and Altman point out that a Cronbach's α coefficient between 0.7 and 0.8 is satisfactory when the scale is used to compare groups and this is similar to the use that would be given in risk adjustment [40].
Streiner et al. [41] indicate that in some scales the items are expressions of the effect of the concept being evaluated and give the example of anxiety that is usually measured through its manifestations. Meanwhile, in other scales the measured concept is made by the union of its items as it happens with quality of life. In the first case it may be desirable that the items are highly correlated with each other and have high "internal consistency". But in the second, this might not be an important feature. The severity index for surgical services, in our opinion, belongs to the second case since the "severity of the disease" is the result of the combined action of different variables. We expect that the addition of all of them, form a real measure of the severity of the patient during hospitalization. Something similar points out Feinstein in his book Clinimetrics [42], where he states that "the evaluation of internal consistency has been little used because many indexes are constructed in a free manner and the items that serve to calculate them generally have different roles and importance ".
As for the items comprised in the evaluated index, there are drawbacks that constitute limitations of the scale. Some points are difficult to evaluate. The most illustrative is the intervention or intervention group, especially since generalizing it to other contexts is challenging. Other items such as the use of urgent or invasive procedures could have a high degree of subjectivity, particularly for non-specialized administrative personnel. This could be mitigated with evaluators training, which is something that this scale intends to minimize. However, the introduction of automated processes in the preparation of the clinical record or a good part of it, would allow professionals who participate directly in the diagnostic and therapeutic process to enter the data themselves in digital forms duly adapted to the conditions of each place. In such a case, the limitations mentioned above would be minimized.
Another possible limitation is that this study was performed in a general surgery service and this index is designed for all surgical services. It may be necessary to validate it in surgical services with special characteristics such as ophthalmology or otorhinolaryngology.
Finally, it is necessary to emphasize that data for risk adjustment continue to be a concern of health authorities that must evaluate the performance of health care centers, particularly hospitals. In a recent article published by the journal Cirugía Española, the weaknesses that still persist in the administrative databases in terms of data available for risk adjustment are pointed out [43].
Most of the known severity of illness indexes are disease specific and not fit for risk adjustment. Their usefulness is mainly in the field of prognostic or prediction of future outcomes in individual patients. Risk adjustment in the world is mainly performed through the Diagnostic Related Groups, or derivate schemes. However, Diagnostic Related Groups, in addition to being criticized for not being able to gather all the severity of patients, is a commercial system with high charges. Its main use is related to the containment of hospital costs through prospective payments and other systems of reimbursement for health care in hospital facilities as an incentive for enhancing quality of care [44].
The index revalidated in this study is easier to apply and its publication in an open access journal guarantees its wide dissemination. Therefore, it may be used by any hospital that, as necessary, implements performance comparisons of its general surgery service in space or time or even to compare performance of surgical teams or surgeons in particular, through any outcome indicator. Although it is a scale that can be regarded as technology, the intention is it can be used by any service or center that needs it or even introduce adaptations that allow its use in different scenarios and situations.
The Physiological and Operative Severity Score for the enUmeration of Mortality and Morbidity [19] used in this study as a gold standard for assessing criterion validity has several similarities to the index we present. However, it requires data from biochemical and hematological variables that may make it difficult to use in scenarios where this tests are not indicated in all patients. However, this index and its subsequent modification, the Portsmouth Physiological and Operative Severity Score for the enUmeration of Mortality and Morbidity [45], have been used and validated in various scenarios. We encourage empirical comparisons with the one presented here as an appropriate basis for the selection of one or the other based on cost/effectiveness.
Conclusions
The results obtained in this revalidation of the severity index indicate that it retains its psychometric properties and can therefore be used in performance evaluations of general surgery services that entail comparisons in time or space. In this way, it helps to enrich the number of instruments that can be used in the risk adjustment for the periodic performance evaluations of these services.
Due to its relative simplicity for health professionals, it is advisable to use it in scenarios where data entry can be automated and, if possible, directly made by professionals involved in patient care: resident physicians, interns or nurses specialized in surgical areas.
Notes
From the editor
The authors originally submitted this article in Spanish and subsequently translated it into English. The Journal has not copyedited this version.
Ethical aspects
The Journal has evidence that the Scientific Council of Hermanos Ameijeiras Clinical Surgical Hospital in Havana (Cuba); was informed about this study and its possible publication in a biomedical scientific journal.
Conflicts of interest
The authors completed the ICMJE conflict of interest declaration form, and declare not having received funding for the preparation of this report, not having any financial relationships with organizations that could have interests in the published article in the last three years, and not having other relations or activities that might influence the article´s content. Forms can be requested to the responsible author or the editorial direction of the Journal.
Financing
Authors declare there were no external funds for this study.
