Research papers
← vista completaPublished on May 9, 2017 | http://doi.org/10.5867/medwave.2017.04.6954
Predictive model for the development of hypertensive cardiopathy: A prospective cohort study
Modelo predictivo para el desarrollo de la cardiopatía hipertensiva: cohorte prospectiva
Abstract
INTRODUCTION Predictive models of cardiovascular conditions are useful tools for risk stratification. The high morbidity and mortality resulting from hypertensive cardiopathy creates a need for the use of tools to predict the risk of cardiovascular disease.
OBJECTIVE To evaluate the capacity of a model based on risk factors to predict the development of hypertensive cardiopathy after ten years in patients with a diagnosis of essential arterial hypertension.
METHODS A prospective cohort study was carried out in hypertensive patients cared for at the specialized arterial hypertension physician’s office of the Specialty Policlinic attached to “Carlos Manuel de Céspedes” Hospital, Bayamo Municipality, Granma Province, Cuba, from January 1, 2000 to December 31, 2009. A predictive model was constructed and validated through a process that included the random split of the whole sample in two parts: one for development (parameters estimation) and the other for validation.
RESULTS The binary regression model adjusted by the “step-by-step backward method,” showed that in step six, 13 variables sufficed to estimate the risk of developing hypertensive cardiopathy. In the estimation sample, the area under the receiver operating characteristic curve obtained for the prediction of hypertensive heart disease was 0.985 (confidence interval: 0.980-0.990; p = <0.0005). In the validation sample the area under the receiver operating characteristic curve was 0.963 (confidence interval: 0.953-0, 0.973, p<0.0005). The calibration of the model was also adequate (p = 0.863).
CONCLUSIONS The model obtained proved is a clinical and epidemiological surveillance instrument, useful to identify subjects with greater likelihood to acquire hypertensive heart disease, and to stratify their risk in the following ten-year period.
Introduction
Predictive or prediction models are becoming more important in the medical literature due to their usefulness in patient care. Among them excel those which permit to estimate global cardiovascular risk by means of risk equations or risk punctuation charts which have been developed based on comprehensive cohort studies [1].
In these models it has been kept in mind that the predictive capacity of multifactorial estimation of risk is greater than the one shown by the consideration of each factor in isolation [2].
At present, there are scales to predict global cardiovascular risk. The most widely used are Framingham’s [3], a scale known as REGICOR [4] and the SCORE mathematical function [5]. The Cardiovascular Disease Risk Algorithm index (QRISK) was recently elaborated [6], a model that includes other risk factors, such as a family history of early cardiovascular disease.
We think that in the future equations to predict cardiovascular risk should address individual entities instead of considering as risk equivalents all the spectrum of cardiovascular conditions since, although they share some physiopathological aspects, they do not have the same incidence and prevalence.
It should be emphasized that, while models exist to estimate global cardiovascular risk, it does not seem coherent to include hypertensive cardiopathy herein. This disease shares several risk factors with the rest of the cardiovascular conditions, nevertheless, some of them can cause left ventricular hypertrophy, cardiac insufficiency and conduction disorders. All these clinical manifestations are present in hypertensive cardiopathy, but it is necessary to avoid confusion.
Hypertensive cardiopathy is, undoubtedly, the damage to target organs caused by arterial hypertension with greater morbidity, disability and mortality. In the development of this condition, there is a group of risk factors that interact with hemodynamic effects which are responsible for high arterial blood pressure. Nonetheless, the degree of influence and Independence of each of them has not been clearly stated, since the results of different studies differ [7],[8],[9],[10],[11].
We recently published an article in which a group of factors were identified showing an important association with the risk of developing hypertensive cardiopathy. Among them were the effects of arterial hypertension, the presence of microalbuminuria, and advanced age [11].
Consequently, with this study we aim to evaluate the capacity of a model based on risk factors to predict the onset of hypertensive cardiopathy in the following ten years in patients diagnosed with essential arterial hypertension. The data used for this purpose are the same used in our previous study [11].
Methods
We carried out a prospective cohort study in hypertensive patients cared for at the specialized arterial hypertension physician’s office of the Specialty Policlinic attached to “Carlos Manuel de Céspedes” Hospital, Bayamo Municipality, Granma Province, Cuba, from January 1, 2000 to December 31, 2009. These patients had four appointments per year.
Inclusion and exclusion criteria
Hypertensive patients who were 18 years old or older and had a past personal history of essential arterial hypertension of five years or more, and who did not have a diagnosis of hypertensive cardiopathy were included.
Patients who suffered from ischemic cardiopathy were excluded from the study, in spite of its high frequency in hypertensive patients. This study aimed at evaluating the isolated effects of arterial hypertension; therefore, the inclusion of patients with ischemic cardiopathy would bring about confusion. For the same reason, patients with interventricular and auriculoventricular conduction disorders were excluded. Likewise, it was checked that the patients did not suffer from other conditions that could provoke cardiopathy. Consequently, patients with a diagnosed myocardiopathy (in any of its clinical forms), diabetes mellitus, thyroid diseases, chronic renal failure, and chronic intestinal inflammatory and collagen diseases were excluded.
Patients with cytostatic treatment at the time of their evaluation for the study were also excluded.
The typical patient’s history was explained in the previous article [11].
During the study, all patients received a uniform initial medical treatment, based on the therapeutic protocol approved by the research ethical committee of the hospital, described in the Cuban guidelines for the treatment of arterial hypertension in use in 1998.
This treatment is personalized according to the patient’s age, skin color, other risk factors and possible contraindications. On the whole, the treatment protocol includes angiotensin II-converting enzyme inhibitor plus a diuretic; calcium channel blockers alone or combined with a diuretic or a beta-blocker alone or combined with a diuretic; or several combinations with the drugs mentioned, according to the patient’s degree of arterial hypertension.
Characteristics of the sample
During the two years prior to the beginning of the cohort evaluation, 3,817 patients visited the arterial hypertension physician’s office. Out of them, 2,646 (69, 32%) came from urban areas and 1,171 (30, 68%) came from rural areas, all of them came from Granma province (Bayamo is the capital city). Taking into consideration the criteria previously stated, 2,551 patients were accepted in the study.
During the 10-year follow-up at the arterial hypertension physician’s office, there were 237 deaths by other causes than hypertensive cardiopathy and 211 dropouts by different reasons (they did not attend the appointments any more, moved to another province, were diagnosed an excluding condition).
Likewise, patients who had a diagnosis of hypertensive cardiopathy during the first follow-up year were excluded from the cohort because it was not possible to evaluate properly the effects of the studied factors. Finally, 2,102 individuals were excluded from the study.
January 1, 2000 was defined as zero hour or beginning of the cohort study. Once the cohort was started it was decided not to include any more patients (closed cohort). Each individual evaluation concluded when the patient developed hypertensive cardiopathy, or at the end of the ten-year follow up period in patients who did not develop this condition.
The sample was randomly split into two same size parts. One half (50% of the sample) was used to perform a multivariate analysis and estimate the binary logistic regression function. The other half (validation group, the remaining 50% of the patients in the study), was used to validate the estimated model. This process was carried out using the algorithm included in the Windows SPSS version 22.0 software.
Definition of variables
This process was explained in detail in a previous article [11] so only a summary is presented here.
Dependent variable: development of hypertensive cardiopathy or not (two categories). Every hypertensive patient was diagnosed with this condition provided that in any of the follow-up appointments they met the following criteria:
Left ventricular hypertrophy echocardiographic pattern: Dévereux’s formula was used [12] (left ventricular mass in grams) = 0.8 (1.04 [left ventricular diastolic diameter + posterior wall thickness + interventricular septum thickness]3 - [left ventricular diastolic diameter ])3 + 0.6. Hypertrophy was considered at a value of ≥ 125 g/m2 in male and ≥ 110 g/m2 in female.
- Diastolic or systolic dysfunction (by echocardiogram): clinical manifestations of cardiac failure of recent onset [13],[14], along with the echocardiographic findings previously described.
- Arrhythmia: persistent atrial fibrillation of long evolution and permanent fibrillation not caused by valvulopathies myocardiopathies, myocarditis, medications and drugs were considered. The diagnosis was based on the patient’s ambulatory clinical history, interview and physical exam. It was later confirmed by a standard twelve-lead electrocardiogram, according to the criteria proposed by the American Cardiology College and the American Heart Association [15]. The electrocardiographic tracing was obtained by the doctor’s office nurse using a CARDIOCID-BB, model A5102 digital portable electrocardiograph.
Independent variables: factors whose influence on the onset of hypertensive cardiopathy was under evaluation, they are described below. All variables were dichotomized. One category represented what was called “exposed” which, according to previous knowledge, implied a greater likelihood for the development of hypertensive cardiopathy. In the other category were included those considered “non-exposed”.
Age was quantified in years.
Patients over 60 years were considered exposed.
Sex was divided in male (exposed) and female.
Smoking was grouped into two categories: smokers (exposed) if they smoked daily or nearly daily cigarettes, cigars or pipe, no matter the number smoked, and exsmokers for less than a year. Nonsmokers are those who did not were in the habit or had quit a year before.
Alcoholism (exposed) was considered the ingestion of more than one ounce of pure alcohol daily, equivalent to an ounce (20 milliliters) of ethanol, eight ounces (240 milliliters) of wine, 24 ounces (720 milliliters) of beer, one and a half ounce (45 milliliters) of rum. In the case of women and patients underweight for their size, were considered exposed those who consumed 15 milliliters per day or more, of any kind of alcoholic beverage [16].
Obesity was established by calculating body mass index (weight in kilograms divided by size in square meters). Every subject with a muscular mass index greater or equal to 30 or with a waist circumference greater or equal to 102 centimeters for men and 88 centimeters for women were considered exposed.
Sedentariness: a sedentary person is one who spends daily less than a certain number of minutes in leisure activities which consume four metabolic equivalents or more (physical activity equivalent or superior in output to stride more than six kilometers per hour or to ride a bicycle at a speed between 16 and 19 kilometers per hour). The patient’s profession was also taken into account [11],[17],[18].
Excessive sodium in the diet. A subject with a salt ingestion greater than five grams a day was considered exposed. This is equivalent to more than a teaspoonful of salt, distributed among the dishes prepared for lunch and dinner. As exposed were also included those patients who consumed bakery products or used table salt (three or more times a week) [11],[16],[19].
The biological markers selected as possible risk factors were cholesterol, uric acid, triglycerides, high density lipoprotein-cholesterol, glycaemia, C-reactive protein, creatinine, microalbuminuria and the quotient cholesterol /high density lipoproteins.
The blood tests for each laboratory test were obtained in the fasting state (8 to 12 hours), and they were centrifuged at room temperature at 2,000 rpm for 10 minutes. Creatinine, uric acid, cholesterol, high density lipoproteins-cholesterol, triglycerides, and glycaemia were measured with a HITACHI 902® machine during the first 24 hours after extraction and the first two ones were expressed in µmol/l and the rest of them in mmol/l. Determination of all the studies were done by means of enzymatic methods.
The cutoff points for the dichotomization of each laboratory variable used in the statistical analysis were established by a method used to obtain optimal cutoff points proposed in the literature. This method is explained later on.
In this way, were established as cutoff points that defined the “exposed” subject the following values: serum cholesterol over 4.8 mmol/l, triglyceridemia greater than 1.7 mmol/l, HDL-cholesterol less than 1.5 mmol/l, cholesterol/HDL quotient greater than 4, glycemia in fasting state greater than 5.4 mmol/l, creatinine greater than 80 µmol/l for, and uric acid greater than 375 µmol/l for. C-reactive protein was determined by the turbidimetric quantitative determination method. Patients were considered exposed if their values were over 4 mg/l.
Microalbuminuria patients were considered exposed when their values ranged from 0.02 to 0.2 g/l in a 24-hour period [20]. It was quantified by means of the Microalb-Latex technique (measurement of the amount of this substance in morning first-void urine specimen).
The value of the quantitative variables resulted from the average of all the three values in the first three appointments of the first follow-up year.
Control of arterial hypertension. As controlled patients were defined those who were under medical treatment with blood pressure readings under 140 over 90 millimeters of mercury (systolic and diastolic respectively) in 100% of the check-ups during every follow-up year, until the onset of hypertensive cardiopathy or the end of the study (at least four readings a year). As uncontrolled patients were considered those who did not meet the previous criteria. For this definition were considered the Cuban guidelines for arterial hypertension [16].
Other arterial blood pressure readings done in other contacts of the patient with the health system for any reason were also considered. The patients were instructed to bring in their arterial blood pressure figures. In order to guarantee the authenticity of this variable, each patient was given a form with the following information: date, time, arterial blood pressure readings, signature and seal of the doctor who did it. The patient presented this document on the day of his arterial hypertension follow-up appointment.
Lastly, the time of evolution and hypertension stage were also considered. In the first case the patients were grouped into two categories: patients with an evolution time between 5 and 15 years, and patients with an evolution time greater than 15 years (exposed). The stage of arterial hypertension was classified according to the proposal of the New York Heart Association Seventh Report. The measures proposed for the correct classification and determination of arterial blood pressure were taken into consideration [15]. For arterial blood pressure determination aneroid and mercury sphygmomanometers, previously calibrated by the Territorial Normalization and Quality Office, accredited for this purpose, were used.
The data were obtained in the doctor’s office during the different interviews done by the authors, every three months during the first year of the cohort and every six months during the next nine years, with the patient’s knowledge and consent.
Statistical analysis
The statistical analysis began with the characterization of the sample, with a description of all the variables. The means and standard deviations, along with the minimum and maximum values of each distribution were determined for the quantitative variables. Absolute and relative frequencies (percentages) were obtained for the qualitative variables.
The samples of the processes of estimation and validation of the model were also compared. For the qualitative variables Pearson’s Chi-square was calculated (independence test). For the quantitative variables the t-Student test was applied, when its distribution resembled the normal one (evaluated by inspection of the histogram and calculation of asymmetry) or Mann Whitney’s U, when a distribution different to the normal one was observed, due above all to asymmetry.
Multivariable model: the logistic regression step-by-step backward mode was used with all the variables which constituted risk factors in the univariate analysis of the article previously published [11]. In this way, the independent influence of each variable on the probability of developing hypertensive cardiopathy was evaluated, adjusting for the rest of the variables. The fit of the logistic regression function, equivalent to the estimation of its parameters, was performed through maximum verisimilitude method. The Hosmer and Lemeshow’s adjustment goodness Chi-square statistic test was also applied. If the probability associated to the test was greater than 0.05, it was considered that the model fitted the data. The logistic regression function is expressed below:
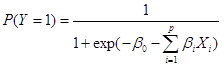
Where: P (Y=1) indicates the probability of developing hypertensive cardiopathy, since variable Y, outcome variable, has two possibilities: 1 if the patient develops cardiopathy or 0 if the patient does not develop the disease. The X’s represent the explanatory variables (defined before) and the P’s represent the number of explanatory variables included. β0 represents the model constant and the rest of β values are the coefficients of the regression model. To obtain the estimation of the probability that a patient develops hypertensive cardiopathy suffices to substitute the patient’s Xs values in the function.
The later development and validation of an instrument (model) to estimate the risk of developing cardiopathy in the next ten years required the division of the sample (10-year cohort) into two halves. With one half the coefficients of the regression model previously explained were estimated and, with the other half the estimated risk function was validated. In particular, the model capacity to discriminate between the individuals who developed or did not develop hypertensive cardiopathy was validated, based on the risk estimation of developing it.
To determine the model discriminant capacity (to distinguish between those who developed and those who did not develop hypertensive cardiopathy) in both samples (estimation and validation) the ROC curve was estimated with the variable probability to develop ischemic cardiopathy and hypertensive cardiopathy (developed yes or no) as truth discernment, the area under the curve was estimated with an interval of confidence of 95%. The model calibration in both samples was also evaluated by means of the Hosmer and Lemeshow test.
Results
A characterization of all the sample was presented in Tables 1 and 2 of the article previously published [11].
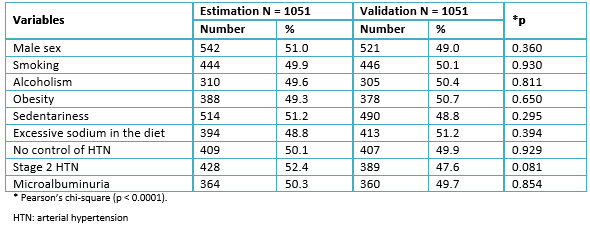
With the aim of estimating the risk function and validating the model, the sample was randomly split. As can be seen in Table 1, the analysis of the qualitative variables showed no significant differences between estimation and validation groups. Similar results were found in the analysis of the quantitative variables (Table 2).
 Full size
 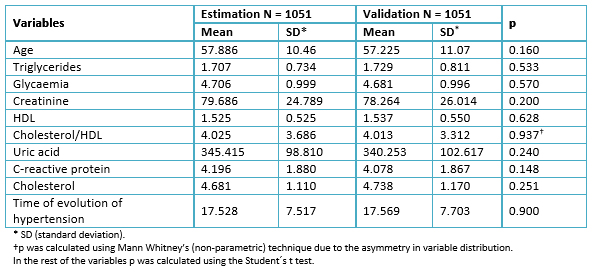 Full size
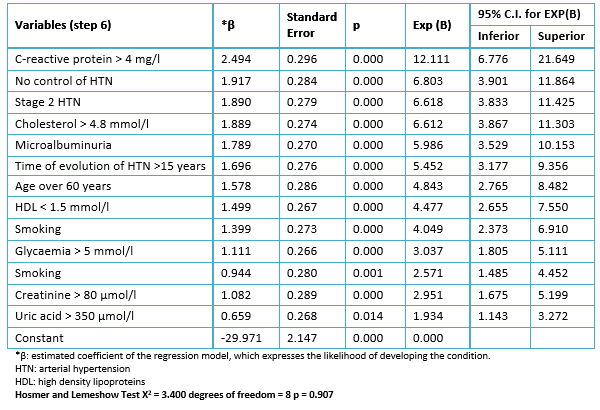
 The binary logistic regression model, adjusted by the step-by-step backward method, was done with the estimation sample to obtain an appropriate adjustment of the model with the lower possible number of predictive variables. The result is shown in Table 3. It was seen in step six that only 13 variables were enough for an adequate adjustment of the model.
 Full size
 Model validity in the estimation sample
The discrimination ability given by the area under the ROC curve was 0.985 (interval of confidence: 0.980-0.990; p<0.0005).
Calibration was measured by Hosmer and Lemeshow’s goodness of fit Chi-square statistic test, which showed that the model fits the data (X2 =3.400; p=0.907).
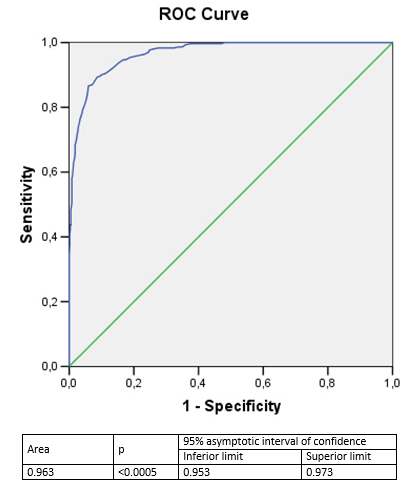
Model validity in the validation sample
Figure 1 displays model validity (discrimination ability). The area under ROC curve was 0.963 (confidence interval: 0.953-0.973; p<0.0005) indicates that the model has a good capacity to predict the risk of developing hypertensive cardiopathy.
 Full size
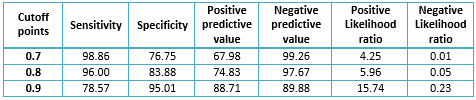
 Sensitivity, specificity and predictive values, according to some cutoff points are represented in Table 4. As can be observed, the cutoff points show high sensitivity and specificity. Negative predictive values are much higher than the positive ones, above all for cutoff points 0.7 and 0.8. This means that there is a low probability that the model would classify as a low risk any patient who developed a hypertensive cardiopathy.
Table 5 shows an adequate relationship between observed and expected cases in all risk levels. The Hosmer and Lemeshow test indicates a good model calibration (p=0.863).
 Full size
 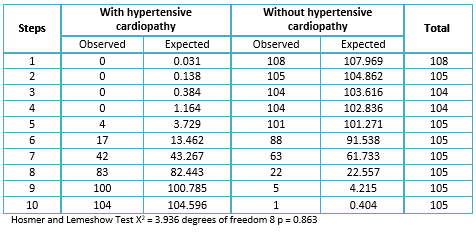 Full size
 Discussion
Hypertensive cardiopathy is the condition affecting target organs with greater incidence and prevalence in hypertensive individuals. In this spectrum of complications left ventricular hypertrophy, cardiac failure, sudden death, myocardial ischemia and arrhythmias are also included [7],[8],[9],[10],[11]. Therefore, identification of risk factors can be useful for the prevention of any form of the disease.
There is an intricate relationship between risk factors and the probability of developing hypertensive cardiopathy, due to the different physiopathologic mechanisms which interact in an inextricable way, [9],[13],[21],[22]. A group of genetic alterations associated to ventricular growth are included [7].
Consistent with the present study, various authors found a relationship between the studied factors and the risk of developing hypertensive cardiopathy. And, although the importance of the hemodynamic overload exerted by arterial hypertension on the myocardium is recognized, there are other factors which are associated independently with the onset of this disease [23],[24],[25],[26], facts that appoint them as risk predictors of developing the disease.
As a solution to this problem, this paper proposes a model which allows to estimate the risk of developing hypertensive cardiopathy in a ten-year period following the diagnosis of arterial hypertension.
A model based on the risk factors found in this series has not been proven for hypertensive cardiopathy. In a study to estimate cardiovascular risk in a Cuban population, De la Noval García [27] found that the use of the cardiovascular risk prediction tables of the World Health Organization/International Society of Hypertension (WHO/ISH), underestimates it in the population studied.
On the other hand, Ang et al. [28] validated a clinical scale to identify left ventricular hypertrophy by echocardiogram. In this study few factors were taken into consideration, so its use can lead to underestimate risk in the Cuban population.
Carlsson et al. [29] show a model in which they found association between endostatin levels and the presence of damage in target organs (endothelial dysfunction, increase in the ventricular mass and microalbuminuria: early markers of damage in target organs). However, in spite of its validity, it has several limitations stated by the authors themselves. In addition to this, its use can be difficult in many health institutions, not only of developing countries but also of the so called first world.
A previous study (index to predict the development of hypertensive cardiopathy), published by Álvarez Aliaga et al. [30], showed adequate discriminative capacity and very high negative predictive values. However, both specificity and positive predictive value were low. The mentioned paper was based on a retrospective study using a univariate analysis, which limited its results and suggested the necessity of improving it.
The validity of the model that we present here is much better. The explanation for this could be that the risk of developing hypertensive cardiopathy has multiple causes and is not the isolated sum of factors, as has been stated before.
Similarly, cutoff points with higher sensitivity and specificity for the biological variables were used, taking into account the characteristics of the population studied and not merely extrapolating results from foreign studies.
Using the World Health Organization/International Society of Hypertension cardiovascular risk tables, in a cross sectional study, Armas Rojas et al. [31], found that most patients were classified as low risk, despite the high prevalence of risk factors in the population studied.
By the same token, in an attempt to evaluate global cardiovascular risk, D’Agostino et al. [32] constructed a model with adequate discrimination ability capacity and calibration, but with the limitation that it was validated in a foreign white population. Cuba is a country with multiple ethnic groups, as the rest of Latin America, so these results might not measure the real risk.
Several models used in Europe to evaluate cardiovascular risk have many limitations. Among them stand out: they calculate fatal but not total risk; they are not tailored for the evaluation of different ethnic groups; they are limited to major (or traditional) risk factors [33].
Unlike the results mentioned above, the present study showed that the area under the ROC curve and the calibration were adequate in the validation sample, as a sign of good model validity in hypertensive patients. The different cutoff points evaluated revealed that sensitivity and specificity were appropriate. Both the study design and the fact that not only classical cardiovascular risk factors but also new factors related to the development and progression of hypertensive cardiopathy were considered [7],[13], can explain our results.
The study has some limitations: it was not possible to study new cardiovascular risk predictors like C-reactive protein, endostatin, homocysteine, among other markers of inflammation and oxidation. Psychosocial factors were not considered either. The latter could be evaluated in future studies. Another limitation was that, although acceptable, specificity and positive predictive values were low. This can overestimate the risk of developing the condition in a number of patients that should not be ignored.
Nevertheless, the long-term results of the intervention on the new risk markers are, up to some extent hypothetic. Besides, their contribution to improve the area under ROC curve is a modest one, compared with the function which includes classical factors exclusively [34],[35],[36].
Conclusion
The present study concludes with the proposal of a predictive model for the risk of developing a hypertensive cardiopathy, based on a multivariate risk factor analysis. The model can be used as an instrument for clinical and epidemiological surveillance, both in primary and secondary health care, by identifying subjects with greater probability to suffer from this condition and to stratify their risk in a ten year period.
We also consider that, unless new studies demonstrate the clinical and epidemiological superiority of the new markers (expensive and with low availability), our results are suitable to stratify hypertensive patients by predicting their risk of developing hypertensive cardiopathy.
Notes
From the editor
The authors originally submitted this article in Spanish and subsequently translated it into English. The Journal has not copyedited this version.
Ethical aspects
The Ethical Scientific Committee at “Carlos Manuel de Céspedes” University Hospital was aware of and approved this study and its possible publication in a biomedical journal.
Interest conflict statement
The authors completed the ICMJE conflict of interest declaration form, and declare not having received funding for the preparation of this report, not having any financial relationships with organizations that could have interests in the published article in the last three years, and not having other relations or activities that might influence the article´s content. Forms can be requested to the responsible author or the editorial direction of the Journal.
Financing
The authors state that there were no external financing sources.
