Research papers
← vista completaPublished on February 22, 2019 | http://doi.org/10.5867/medwave.2019.01.7579
Validation of the positive and negative affect scale in the Chilean population and its application on migrant people
Validación de la escala de afecto positivo y negativo en población chilena y su aplicación en personas migrantes residentes en Chile
Abstract
Introduction Although the positive and negative affect scale proposed by Mroczek and Kolarz has not been as widely used as other instruments, the adequate psychometric properties reported and the simplicity of the application, make it an adequate instrument to measure the hedonic component of subjective well-being. Thus, the scale validation in Chile will allow researchers to have a short and reliable instrument available in order to measure subjective well-being.
Objective The initial objective of this study was to in Chile the "Positive and negative affect scale" proposed by Mroczek and Kolarz.
Methods A non-probabilistic sample of 155 Chileans and a sample of 308 adult immigrants residing in Chile from Colombia, Peru and Venezuela were recruited. The sample of Chileans was used to validate the scale. The construct validity (Cronbach's α and exploratory factor analysis) and the concurrent validity through bivariate correlations with other measures were estimated. Finally, the differences in affect expression by Chileans in comparison with migrants’ people were evaluated.
Results The reliability index was α = 0.92 for the positive affect sub-scale and α = 0.75 for the negative affect sub-scale. The exploratory factor analysis reproduced in the same way the factorial loadings proposed in the original instrument with saturations > 0.35 per item. Colombian and Venezuelan migrants show greater expression of positive affect than Chileans, while this difference is not observed when comparing Chileans with Peruvians.
Conclusion The positive and negative affect scale has adequate psychometric properties to measure the expression of affect (hedonic well-being) in the Chilean population.
|
Ideas clave
|
Introduction
The field of well-being could fall under the umbrella of two big traditions: one which focuses on human potential (eudaimonic well-being) and the second which centralizes on happiness (hedonic well-being)[1]. The latter of these approaches is linked to subjective well-being and, according to evidence, is made up of three components: the expression of negative affect, the expression of positive affect and life satisfaction[2]. Life satisfaction accounts for the distance perceived by people in relation to their aspirations, thus it is linked more to cognitive components. On the other hand, negative and positive expressions of affect are related to more immediate experiences, contingent or situational, that a person lives. The latter would not implicate instability in the expression of affect produced by the influence of emergent events given that, as Headey and Wearing[3] suggest, after experiencing emergent events, people tend to adapt themselves to the situations, returning to the initial point of balance from before the event.
The balance of the expression of positive and negative affect is, from Bradburn’s[4] perspective, that which accounts for the degree of happiness perceived by people. Specifically, positive affect represents the dimension of positive emotionality which is expressed through joy, a good mood, from the sensation of plenty and tranquility in life. Conversely, the expression of negative affect represents emotional expression characterized by desperation, sadness, a sense of low social value and unease, among other aspects[5].
As for the structure of the scale of positive and negative affect, although both expressions of affect (the negative and the positive) are related, they are represented by two different conceptual dimensions. It is for this reason that in the literature it is suggested that they should be measured separately[6]. Therefore, according to Bradburn’s initial proposal, different studies have reported the distinction between both dimensions with moderate to high inverse correlations between them[7],[8],[9],[10].
In relation to the explanatory variables of subjective well-being, these can be linked with genetic aspects, personality traits and social-cultural variables. Tellegen and collaborators[11] investigated the genetic component of happiness by following different pairs of twins who were temporarily separated, both monozygotic and dizygotic, estimating that 40% of the variability in positive affect and 55% in negative affect could be predicted by genetic variation. Regarding personality traits, those who tend to be extraverted present moderate to high correlations in the expression of positive affect[12].
The way in which people think about the world and their own circumstances also influences the expression of affect Those who have a greater disposition to recognize the positive aspects of life, that have realistic expectations regarding control of external situations, who are confident and cautiously optimistic; present greater expressions of positive affect[13]. The same occurs when these people develop goals and structure clear and feasible life projects. They tend to be happier, enthusiastic and with a greater level of vital energy.
Cultural context, also is described as one of the variables with more influence when explaining subjective well-being. In this sense, it is of special interest to differentiate individualist socio-cultural contexts from collective ones. In the former, personal thoughts, options and feelings are more highly valued. This explains why self-esteem and the coherence of acts based on personal values correlate more strongly with the expression of positive affect in individualist societies than in collective ones. On the other hand, in collective societies, people are more willing to disregard themselves in favor of group interests and their expression of affect considers the link with others[14],[15]. In more individualist societies, people, when questioning their level of life satisfaction, generally make connections with their own feelings, unlike people in collective societies who, when faced with the same question, have in mind their family, friends and peers social evaluations and usually refer to social norms[16].
In relation to the present study, the aim is to validate the Positive and Negative affect Scale proposed initially by Mroczek and Kolarz[6] in the Chilean population in order apply then on resident migrant populations in Chile (Colombians, Peruvians and Venezuelans). The aim is to compare the results obtained by the sample of Chileans with the migrants to explore differences in the expression of positive and negative affect between the groups.
Ethical Aspects
This investigation was reviewed and approved by the Scientific Ethics Committee from the University of Valparaiso (Comité de Ética Científica de la Universidad de Valparaíso), which is accredited by the Ministry of Health (Ministerio de Salud) in Chile. The participants´ information was incorporated anonymously to a database of the statistical program SPSS v.22.
Methodology
Participants and Procedure
The participants were given a survey after having read and signed the informed consent agreement, which guaranteed, among other aspects, the anonymity of the participants. The gathering of data was carried out by a team of professional survey-givers who applied the surveys either in public spaces or in the houses of the participants. They explained to the participants that the study was part of a research project which tried to account for different aspects of life between resident people in Chile.
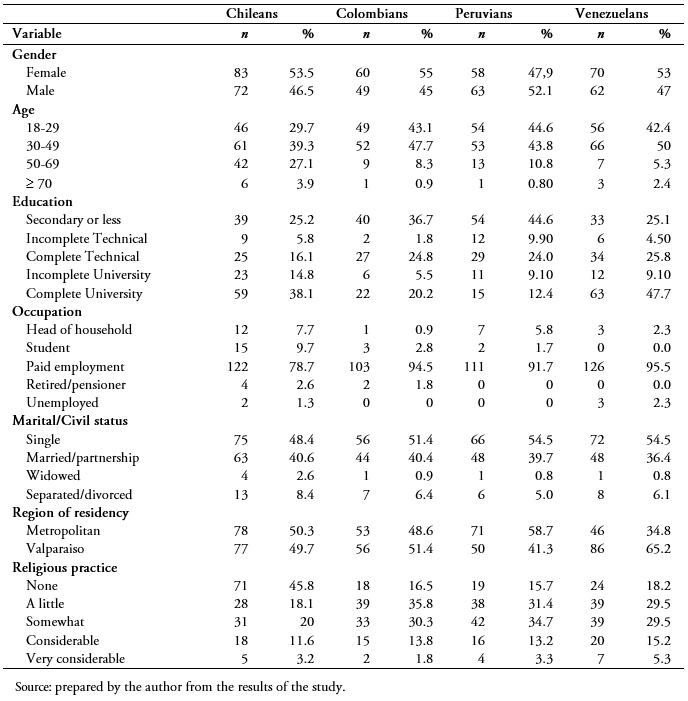
The non-probabilistic sampling was gathered in two regions of Chile: The Valparaíso and the Metropolitan Region. For the purpose of scale-validation, 155 participants of Chilean nationality whose ages fluctuated between 18 and 78 (SD = 14.85) were conscripted. The sampling was designed by looking for a homogenous distribution in gender variables (n women = 83 [SD= 14.89]; n men = 72 [SD= 14.09]) and the level of education (n technical or less= 47.1%; n incomplete university education or superior= 52.9%). The validated instrument was subsequently applied to a sample of migrant participants of Venezuelan, Colombian and Peruvian nationalities residing in the same regions as the Chilean participants.
 Full size
 Instrument
The Positive and Negative Affect Scale. The validated Spanish version by Diaz, Blanco and Durán was used with one answer option added to avoid the preference of indecision. In this way the participants were asked to answer to a six-options Likert scale. These were: (1) never; (2) only once; (3) sometimes; (4) many times; (5) almost always; (6) always. Higher scores in each of the sub-scales indicated greater expression of that affect, so it was expected that the correlation between both scales would be medium to high with the negative coefficient. According to the results obtained by Mroczek and Kolarz the reliability coefficient α Cronbach was α=0.87 for the sub-scale of negative affect and α=.91 for the sub-scale of positive affect.
To evaluate the validity of the construct, the Cronbach’s α from the full scale and of the two subscales was estimated with the Chilean sample. Subsequently the pertinence of the data was evaluated to carry out an exploratory factor analysis (KMO and X2 Bartlett). The eigenvalues of the matrix of correlations were estimated and the scree plot was presented in order to make the decision about the factors to extract.
After, the factor loadings were estimated for the respective factors. To evaluate the concurrent validity, bivariate correlations were done between the scores of the measurements. To achieve this, the scores in the scale of positive and negative affect were correlated with the measurement of the “Feeling of Happiness” proposed by Wold[17] and with the general measurement of “Life Satisfaction” proposed by Keyes, Shmotkin & Ryff[18]. After conducting the estimations with the Chileans sample data, Student’s T-test for independent samples were estimated to evaluate the existence of differences between the means of Chilean sample and that of the Peruvian, Colombian and Venezuelan migrants.
With the objective of predicting the scores in the dependent variables of positive affect and negative affect, a linear regression was estimated considering as independent variables gender, age, education and religious practice.
Results
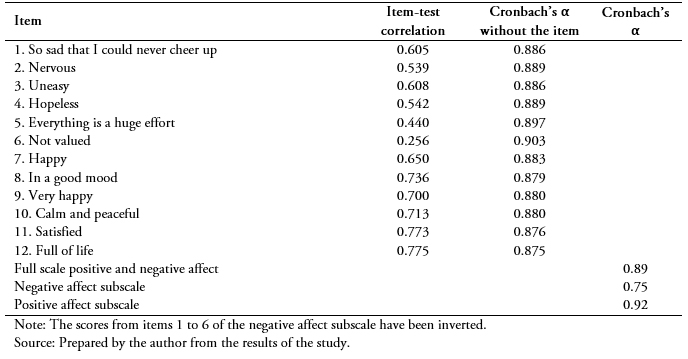
According to Nunnally Berstein’s criteria[19] the full scale of positive and negative affect (12 items) presented a high reliability (α = 0.89) similar to the subscale of positive affect (α = 0.92). On the other hand, the negative affect subscale presented an acceptable reliability rating (α = 0.75). The correlation item-test for the entire scale (12 items) ranged from 0.256 to 0.775.
 Full size
 Exploratory Factor Analysis
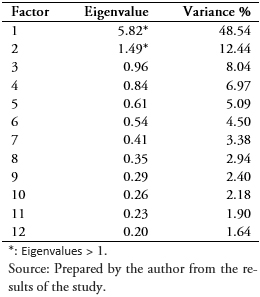
The analyses for the sample demonstrated adequate levels of adjustment for the factor analysis, where KMO = 0.894 and X2 Bartlett (66; N=155) = 980.50; p< 0.001. The exploratory factor analysis was completed with the 12 items from the scale. The method of extraction used was the maximum likelihood estimation with direct Oblimin rotation. The results of the parallel analysis (Table 3) and the scree plot (Figure 1), suggest the extraction of two factors, compatible with the structure of the original scale.
 Full size
 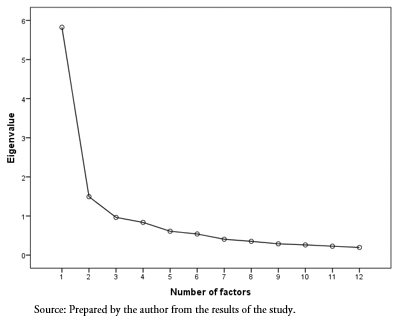 Full size
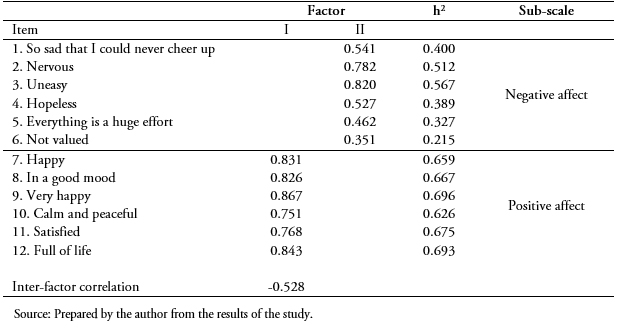
 On Table 4 are informed the items factor loadings of the scale. The results indicates that both factors grouped the corresponding items in a clear and differentiated way from one subscale to the other (high factorial saturations > 0.35), replicating the results in an identical way to the factorial structure proposed originally by Mroczek and Kolarz. The inter-factor correlation between the sub-scales was medium and negative (r = -0.528), which was expected given that one of them measures the expression of negative affect and the other of positive.
 Full size
 Concurrent validity
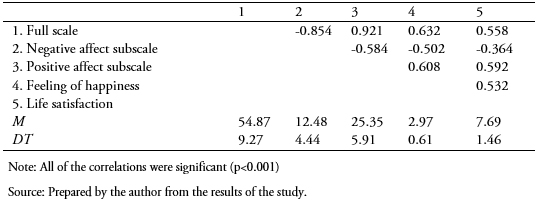
In table 5 the bivariate correlations are included among the full scale, the sub-scales, the measurement of “feeling of happiness” and the measurement of “life satisfaction”. All of the correlations were high and statistically significant (p < 0.001). Given that the scores of the items on the full scale of positive and negative affect were inverted, a high and negative correlation was expected with the subscale of negative affect (r = -0.854; p < 0.001). According to what can be expected, the correlation between the full scale of positive affect and the measurement of “feeling of happiness” was medium-high (r = 0.632; p < 0.001) similar to the measurement of “life satisfaction” (r = 0.558; p < 0.001).
The negative affect sub-scale correlated inversely with the measurement of “feeling of happiness” (r = -0.502; p < 0.001), which indicates that the people who reported greater expressions of negative affect also shared lower levels of subjective happiness. Likewise, those who reported greater levels of negative affect also presented lower levels of “life satisfaction” (r = -0.364; p < 0.001).
 Full size
 In executing a backwards method elimination with the sample of Chilean participants, where the score of the positive affect scale was included as a dependent variable and gender, age, education and religious practice as independent variables; the variables are ruled out (model 5 only includes the constant), which allows one to interpret that the independent variables incorporated in the model do not predict the score of the positive affect scale.
In the case of the negative affect scale (dependent variable), gender, age, education and religious practice were considered as independent variables. The final model that is adjusted to the data only includes the level of education variable (F (6.285.) = 1.9; p < 0.05). Therefore, one can conclude that this independent variable explains the changes in the scores of negative affect, ruling out the effect of the gender, age and religious practice. The typified regression equation that allows for the explanation and prediction of the negative affect scores is: z negative affect = -0.641* (Zeducation). In having a negative value coefficient, it stands to reason that a greater level of studies indicates a lesser expression of negative affect.
Comparison of the mean between the samples
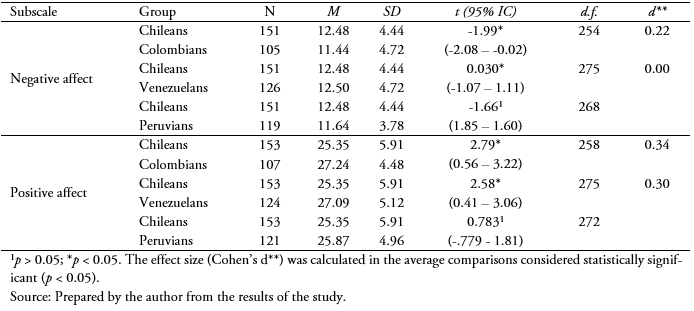
As a strategy to establish the scale’s criterion validity, diverse mean contrasts were completed (Table 6). One of them was the contrast in the scores of the sample of Chileans and Colombians in the Negative Affect sub-scale. The difference was statistically significant, which allows for the affirmation that the Chilean sample express greater feelings of negative affect than the Colombians (M Chileans = 12.48 > M Colombians = 11.44; p < 0.05). This difference in the expression of negative affect is not observed when between Chileans and Venezuelans, nor between Chileans and Peruvians (p > 0.05).
The results of the mean contrast in the positive affect subscale accounts for significant differences in the expression of positive affect between Chileans and Colombians (M Chileans = 25.35 < M Colombians = 27.24; p < 0.05) and between Chileans and Venezuelans (M Chileans = 25.35 < M Venezuelans = 27.09; p < 0.05). The contrast of averages does not allow for the conclusion that there are significant differences between expression of positive affect by Chileans in regards to the expression of this affect by the Peruvians (M Chileans = 25.35 < M Peruvians = 25.87; p > 0.05).
 Full size
 The purpose of this study was to validate in a chilean sample the Positive and Negative Affect Scale, originally proposed by Mroczek and Kolarz. Once the scale was validated, a comparison was made between the results obtained by the Chilean sample and those obtained by the Colombians, Venezuelans and Peruvians who reside in Chile.
The six items sub-scale (those of positive and negative affect) presented an excellent item-test correlation and adequate levels of reliability. The full scale and each of the sub-scales, showed excellent internal consistency, comparable with the original version. Through the exploratory factor analysis, the bifactor solution was the one that best fit the data. The distribution of the items, according to their factor loadings, was identical to the original structure. As one sub-scale measured the expression of positive affect and the other of negative, the correlation between both was moderated with a negative coefficient. These results also correspond with those obtained by other authors who have used the scale in different contexts[17],[19]. In turn, the correlations of medium and significant intensity (p < 0.001) between the sub-scale of positive affect and the measurements of “feeling of happiness” and “life satisfaction”, like those obtained by the negative affect, but with a negative coefficient, show evidence of the concurrent validity of both sub-scales.
Comparing the scores between the samples, the Colombians obtained a greater level of positive affect expression and less of the negative when compared to the Chileans. These results are compatible with the results from the World Database on Happiness, where the Colombians are in first place among the 90 countries surveyed[20].
With these results it stands to reason that the level of happiness of the Colombians cannot be explained solely within their national context, but is a condition that is also maintained outside of it, despite the difficulties of a migratory experience, such as the one are currently carrying out in Chile.
Similarly, in Spain, an investigation with Colombian, Bolivian, Romanian, Sub-Saharan African and Moroccan migrants showed inferior levels of mental health than those of the Spanish, with the exception of the Colombians who obtained indicators similar to those of the native population[21]. In that regard, it is widely described as happiness, and thus the expression of it promotes positive indicators of mental and physical health, fosters positive social relationships, increases a person’s vital energy and reduces stress and the rates of accidents and suicide among other aspects.
In general, the Colombian’s high levels of happiness cannot be explained by objective conditions such as income level, country of residency, transportation, among others. Previous research have pointed out important variables to explain the happiness of Colombian people that are linked closely to everyday life, such as family, their affectionate relationships, work environment and some individual conditions such as self-efficacy[22],[23]. The data also reported that Venezuelans show a greater expression of positive affect in comparison with Chileans. This result could be explained by the aforementioned reasons with regards to the Colombian sample; one could conceive that, due to the close geographical proximity of people with these two nationalities, there is a common foundation in which the appreciation of personal relationships as well self-efficacy are shared.
One area where there were not significant differences, neither in the expression of positive affect nor in the negative, was between the sample of Chileans and Peruvians. Those results support the low impact of the “country of residence” variable to account for people’s subjective well-being. In the Chilean’s case, the lower levels of expression of positive affect and the higher expression of the negative could be explained by the individualistic society that they are a part of, characterized by high levels of competitiveness, significant stress levels and a reduced social support network. In this sense, a reasonable explanation of the results between Chileans and Peruvians may be due to an assimilatory time effect by the Peruvian migrants, given that the Peruvian migration has a long history in Chile unlike that of Venezuelans and Colombians.
This investigation has some limitations. The sample is not a probability sample so caution should be taken when generalizing the results. In order to have a greater understanding of the differences in scores between the samples in the expressions of affect sub-scales, other variables should be incorporated into the analysis to enrich the interpretation of the results. In this sense, it would be relevant to consider the impact of the effects of moderating and the mediating variables in the explanation of the expression of positive and negative affect.
Conclusion
The positive and negative affect scale present psychometric properties that are adequate for measuring the expression of affect (hedonic well-being) in the Chilean population.
Colombian and Venezuelan migrants show greater expression of positive affect than the Chileans, whereas this difference is not observed when comparing Chileans with Peruvians.
In future research, measuring the life satisfaction variable together with the expression of positive and negative affect is suggested in order to verify the factorial structure of subjective well-being in the Chilean population.
Finally, it is important to mention possible new lines of investigation that arise from this investigation, such as the execution of a validation exercise with a confirmatory analysis in a representative sample or the exploration for proof of validity and reliability in the migrant population.
Notes
Declaration of Funding
This study was financed by the Comisión Nacional de Ciencia y Tecnología (CONICYT), through the Postdoctoral FONDECYT Nº 3170187.
Declaration of ethical aspects and conflicts of interest
The author declares that this investigation was reviewed and approved by the Comité Ético Científico from the Universidad de Valparaíso, following the Acta de Aprobación Bioética CEC142-17 on the date of April 11, 2017.
Declaration of conflict of interests
The author declares that there are no potential conflicts of interest in regards to the investigation, authorship, and/or with the publication of this article.
