Methodological notes
← vista completaPublished on December 28, 2018 | http://doi.org/10.5867/medwave.2018.08.7396
Modeling the epidemiological impact of a preventive behavioral group
Modelización del impacto epidemiológico de la existencia de un grupo conductual preventivo
Abstract
Concerning health, experience indicates that in all human groups a percentage of individuals behave conscientiously when facing contagious diseases. This aware group responds with activities to prevent disease transmission and to minimize risk. In contrast, other individuals tend to behave with less engagement except in catastrophic cases. Assuming the theoretical and methodological framework provided by mathematical epidemiology, and based on a Susceptible – Infectious - Recovered (SIR) model, we evaluated the factors of size and intensity of the behaviours in the aware group to determine the basic reproduction number. This number is the reduction in the number of secondary cases that would be produced by a first infectious individual. Additionally, we calculated the total and individual prevented prevalence for each aware individual for different parametric scenarios. Lastly, we suggest that distance and interpersonal contact should be included as factors associated to the potential of transmission.
Introduction
Modern times, changing behaviours and social movements demand the inclusion of more realistic scenarios in epidemiological modellings of human contagious disease transmissions. One aspect to be considered is whether these analyses are capable of capturing the variation in human behaviour, and assess the effects on the models predictions[1],[2]. Nevertheless, as we pass through the analysis to synthesis, the different aspects should be firstly independently incorporated and subsequently develop more complex models to integrate such phenomena.
According to experts, health awareness behaviour, targeted to avoid infectious disease risks, are characterized by many factors including: religion, cultural and socioeconomic status and personal beliefs among others[1],[3]. As a result, it can be stated that in regard to health awareness, every social group is composed of people in different behavioural categories that depend on individual circumstances, as previous investigations have claimed.
Logically, human responses can be classified into two distinct categories in the face of infection risks. One group has poor awareness, attributed to disinterest or people who exhibit only minor behavioural changes; the other group are engaged individuals who undertake activities clearly targeted to prevention and control of the diseases[1]. As a result, the total population can be divided into at least two different patterns of behaviours when an epidemic starts. Disease evolution is quite sensitive to human behaviours and to the sizes of those social groups. Moving individuals from one group to another to improve the indexes, demands a change in individuals lifestyle wether healthy or sick framed in a wider context of behaviours. However, changing social and psychological paradigms is beyond merely biological, social or cultural patterns; because aspects such as personality, self confidence and psychosocial balance are required. Therefore, every social change entails reaching an appropriate threshold within the right behavioral category. Even though, if a person seems to behave with apparent awareness of infectious risk, perhaps a stronger resolve is still required to ensure a more effective response in his/her actions.
Educated and responsible citizens, in terms of health behaviour is an important issue for the health system in order to prevent and reduce disease. It is apparent a lack of specialized literature quantifying how a behavioural group can make a diference in this respect. As an example the effect that a standard versus a raised awareness behavior has over the proliferation of an infectious disease. Basically, there are two complementary approaches to quantifying this health impact:
a) A statistical framework, using extant or simulated datasets, with or without consideration of specific social behavior. Examples of these are a study conducted in China based on mixed social activities within urban and rural areas[4], or a study, in which the personal space is modelled[5] through a Gaussian Bidimensional function.
b) Mathematical modeling that includes hypotheses relating to human behaviours in the epidemiological context of infectious disease employing computational simulations. In this respect, a mathematical approach based on personal contacts aggregated by age groups[6], and a recent study based on a SIS epidemic model, using susceptible individuals, with a time delay before the tawareness response[7] of susceptibles.
In this context, the better methodological perspective seems to be the mathematical approach, because it better quatifies human behaviour dynamics, and better explains its epidemiological consequences[6],[7],[8]. In particular, the compartments and the size variation laws, which clearly identify behavioural characteristics for each group[1],[2],[6]. Consequently, the main challenge is the establishment of baseline behavioural groups within the model. It is clearly noticeable that those types of behaviours result in a greater or lesser probability of spreading the infectious to a new host.
The purpose of this article is to highlight through a mathematical approach (a deterministic dynamical system) and subsequent indexes, the importance of existed behavioural groups and their sizes for developing epidemiological modelling transmission of infectious diseases. To this end, the epidemiological impact is measured over such heterogeneity of susceptible individuals, to develop a predicted prevalence. Once these aspects are more clearly identified and quantified, the results can become a useful tool to guide public health policies aimed at mitigating the health impact by promoting human behavioral changes to reduce infection transmission.
Objectives
In the particular field of rapidly spreading infectious diseases which produce a significant outbreak (ie. an epidemic pulse) such as influenza; this research aims to answer the following questions:
- How much and how do the existence of awarne individuals within the whole population affect the magnitude of final prevalence of contagious?
- What are the gains or losses, i.e. greater or lower prevalence by increasing or decreasing the proportion of aware individuals, in a relative form, in the whole population?
- Are there any significant differences between the existence of full aware or slight aware individuals by facing infectious disease across different societies with similar features relevant to the disease transmission?
- What type of aware individual has greater impact on the evolution of the epidemic, the aware individual who is susceptible to the disease or the individual who is an infectious agent?
Behavioural types
In every society, there is a distinct group of aware citizens, who take preventive health measures, both for themselves (when they have not yet been infected), and for their peers and surrounding contacts (when they carry the infectious disease). This group, have been called the aware group and by simple complement, the other is called the standard group. Might it be important for preventive public health management purposes to know the health impact on the whole population (and with respect to one group or the other) of increasing the proportion of aware individuals as a preventive measure? Although it is logical to expect it is beneficial, the goal of the present study is to quantify it.
Identifying a health awareness group within the whole population, requieres acknowledgement, consience and epidemiological attitude by performing permanent basic activities targeted to the control and prevention of transmissible infectious diseases. In this context, matters described in public domain documents such as the Manual for Control and Prevention of Infectious[9], could help to stablish the inclusion or not of individuals within the awareness category. More precisely, it refers to a certain level of observable compliance with standards elements such as: hand hygiene, isolation, respiratory hygiene, educational standards when coughing, disinfection and washing personal utensils among others.
Having an infectious disease and two similar environmental and demographic locations, questions can be asked about the reasons why substantial differences in the final size of an infection could appear. An explanatory factor could be the existence of greater proportion of individuals maintaining and / or promoting constinuous self care behaviours when the epidemic outbreak occurs. Nevertheless, to know how far this hypothesis stands, it is necessary to measure how large this difference could be. For obvious reasons in the present study, an experimental scenario is not addressed, but it is simulated. Hence, the development of a mathematical model is required that allows us, in terms of a simplified reality to perform a full analysis with well defined boundaries. In this respect, a classic mathematical modeling of infectious diseases, widely used in epidemiological analysis[10], was performed in this study to describe compartmental groups (susceptible - infectious - removed), following the assumptions below:
- The whole population, was aggregated not only according to the states of the disease, but also according to health behaviour, defined as follows: standard group (E) or aware group (C).
- Groups E and C represent a percentage of the whole population, defined as: QE% and QC% respectively, where QE% + QC% = 100%. These measures are treated as fixed values, along the disease evolution.
-
A likewise probability of encounter or intergroup contact is assumed. However a difference lies, in the likelihood that those contacts effectively occur or not in order to produce the contagion process. It is also assumed that an aware individual (C) diminishes the encounter probability by a factor denoted by fS and fI, with fS,fI ∈[0,1] depending on whether the aware individual behaves as susceptible or infectious.
Disease dynamic
Although Mathematical technicalities in conjunction with argumentative formal details are avoided in this study, such calculus are presented in the final section. Instead of that, explanation and analyses are based on diagrams, tables and some graphs as a result of numerical simulations.
Under epidemiological assumptions of spatial and age homogenity, one of the classical mathematical models of infectious diseases, assumes three well defined groups of individuals: Susceptible, Infectious and Recovered[6]. Assuming that their sizes are time-dependent variables, on the t-th day of the disease, after arriving an initial number of infectious (zero day) into the system, the representation can be denoted asS(t), I(t) and R(t) respectively.
In relation to distance holding by two or more individuals (issue discussed in further detail in section "Distance and interpersonal contact"), a criterion can be defined to discriminate whether those individuals can met, (contact) or not. To this end, we can note that the number of feasible encounters between individuals from the susceptible and infectious groups are represented by the product S(t)I(t). Indeed, only a fraction of those encounters really occurs; and even more, they occur only in a little fraction of the latter when an appropriate distance is reached, allowing the pathogen moving from on host to another. Which in turn, it is given only with certain probability, which depends on many factors, including for instance, how long the meeting is held. As a result, only a very small fraction of feasible encounters between susceptible and infectious, are succeed. We can notice that one of the limitation of those models (susceptible - infectious - recovered), is the non-existence of a latent-period, it means that the contagion is instantaneously passed through.
It is implicitly stated, that a susceptible - infectious - recovered model assumes two basic flows: they are the infectious flow (S→I) and the recovery one (I→R). For the infection flow, it is assumed that per unit time (one day) the sum change compartment B%S(t)I(t) of susceptibles (i.e. an infectious infect B% of the susceptible group). In regard to the recovery flow, if the average time of holding the disease is T-days, then (1/T)I(t) infectious individuals recover, per unit time. Further deatails can be found in[10].
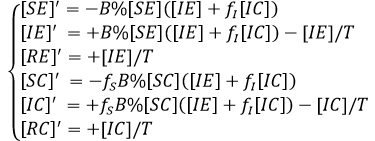
In Table 1, the types of potential encounters are illustrated. In other words, the potential combinations are considered when crossing infectious types with behavioural types .
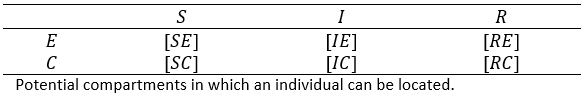 Full size
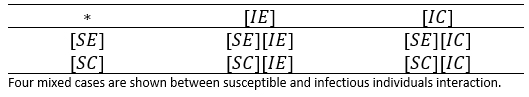
 Thereby, if the expressions [XY] of previous table, represent the number of individuals in such condition, then the potential encounters between susceptible and infectious individuals can be illustrated in table 2.
 Full size
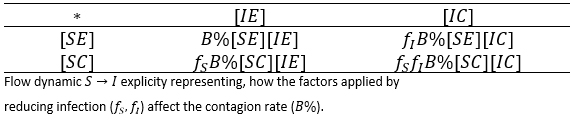
 Table 3 shows, the four different components of the flow S→I; it means, the number of new infective individuals per unit time. Those values are represented according to table 2, and in terms of the contagion rate corrected by the associated reduction factors of the aware group.
 Full size
 We can note, that under the assumption that a person after being infected not change her/his behaviour, i.e. if an individual is [SX], any X among the options (X∈{E,C}) and becomes infected, he/she could enter to the group [IX]; with similar X state and similar behaviour. Thus, first and second row, generically X -row, indicates how X type of susceptible, is infected with the different infectious types, i.e. the flows towards infectious standard and aware can be expressed respectively:

and

Factorizing result:

and

The flow is completed, once the recoved stage is considered,[IX]→[RX] for each behavioural type X∈{E,C}. The assumed recovery time (independent of the behavioural type) is (1/T)[IX] individuals per unit time. Because the removed ones, do not participate in the contagion dynamics, it can be defined a single group of removed individuals as follows: [R]=[RE]+[RC].
Both flows (infectious and recovery ones) stablish the evolution law of infectious disease, which is mathematically represented as a differential law according to the equations proposed in section "Mathematical elements".
Distance and interpersonal contact
The factors fS and fI, called as reduction of infection rates, are strongly associated with the transmission likelihood of the pathogen agent. The umber of contagions are sensitive to human contacts and closeness between individuals[1],[6]. In terms of pneumonia for instance, an historical study of pneumonic epidemics conducted in Manchurian 1910-11 and 1920-21 revealed a risky distance between 5 [cm] to 2 [m][11] when coughing. Well known recommendations to avoid the drops exposure of saliva when coughing or sneeze, are covering mouth and use of artificial masks[12].
Personal distances allowed in daily life with respect to other individuals and objects, are subject of deep analysis for the proxemics Science, see Edward Hall, 1968[13]. The personal space (bubble around human body) that an individual allows during daily relationships, has an epidemiological importance with a diversity of factors associated, such as: personality, age, gender, social status, type of relationship between peers[5] and cultural contexts[13],[14].
This personal space is composed by several layers, according to a variety of allowed distances (intimate 0 to 0.45 [m]; personal 0.45 to 1.2 [m]; social 1.2 to 3.5 [m] and public with more than 3.5 [m]), the individuals can keep in relation to others[5]. It is observed that some layers are inside the critical zone of pneumonic risk, according to previous statement. Therefore, it could be expected that an aware individual handles the environment through larger average distances, in order to reduce fS and fI .
In this regard, the proxemic warns different layer diameters of personal space, according to cultural behaviours, that could explain differences between transmission patterns of infectious diseases in different locations. Anglo-Americans, for instance tend to socially interact with distances greater than those allowed by Latinos individuals, who also include physical contact[14]. In addition, according to the aforementioned study, there are also differences of personal contact and social closeness among members of Latin American countries, and even among gender encounters. As a result, an unique (or universal) index to represent human contact for all cultures is not possible to identify[13],[14].
There are scientific evidences of association between the pathogen transmission and the allowed distances between individuals[4],[11]. In a study conducted in Great Britain[15], an statistical approach revealed that the contagion probability between susceptible and infectious individuals decreases according to the distance, based on the Power Law formulation. The finding shows a dependency between spread of foot-and-mouth disease and contact probability associated with farm distances. Consequently, contagion transmission among cattles resulted to be inversely proportional to the farm distances. Another recent study conducted in Bangladesh, using Chikungunya data, was based on an exponential distribution to characterize the transmission probability between human communities and distances[16]. This study confirms that social patterns, spatial structures and behavioural dynamics can be incorporated within modern epidemiological models.
Finally, it can be stated that distance and physical contacts are factors that need to be included into mathematical models for more epidemiological accuracy. These cutting edges approaches are aimed to better understand the real dynamics of infectious diseases targeted to develop more effective health interventions in accordance to the new realities of the modern world[4]. In this study, merely explanatory about the issue, have revealed that distance (or frequency on physical contacts) are factors with negative (or positive) correlation regarding the indexes y , proposed in this model.
Results
Estimation of basic reproductive number
A direct assessment of the basic reproductive number (secondary cases generated by a first infected individual within a population free of infection) is given by

This is an statement that, when there is no behavioral difference with consequences in the rate of infection (fS=fI=1) it can be concluded that R0=B%T, which corresponds to the basic reproductive number of the classical susceptible-infectious-recovered model (QC = 0). Further details on , are given in section "Mathematical elements" below. In this respect, the percentage reduction i% in the number of secondary cases produced by a first infected individual within a free of disease population, based on the aware group is as follows:

A percentage that grows having a greater representation of aware individuals or having an increased levels on health aware, implies a reduction on factors fS and fI. For instance, if one of 10 individuals is able to reduce their infectious encounters at 50% (acting either as susceptible or infectious), then the percentage of reduction of secondary cases is 7.5%.
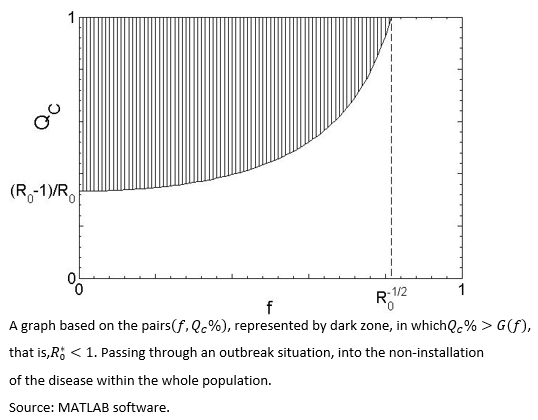
Note that if the group is absolutely optimal aware to reduce the infection rate, either as susceptible or infectious (fS =0 o fI =0), it can be stated that = (1 -QC%), it means a reduction to the most the basic reproductive number in the whole percentage of the total population. In general, if , then if:
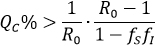
By assuming fS=fI=f, then the pairs which allows a reduction of to at less one, are those that satisfy QC > G(f), with G(f)=(1-R0-1)/(1-f2), inside the dark zone shown in Figure 1.
 Full size
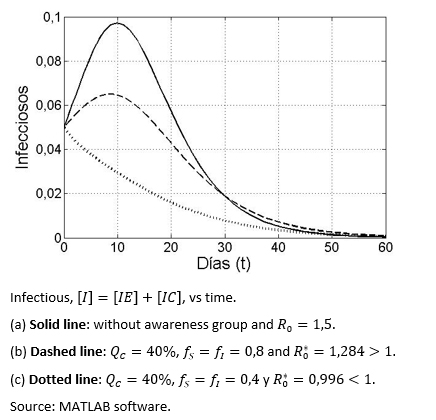
 Figure 2 shows three different scenarios in terms of the evolution of the infectious disease over time, with and without aware group, in the latter case having greater or less than one.
 Full size
 Prevalence ratio - preventive group size
Measuring I% is important in terms of reduction of secondary cases, meaning the exclusion of some propagation chains. However, to know the avoided prevalence, two different indexes, able to model the dynamic of the infectious (similar), are presented.
Avoided Prevalence: It is represented by [R]*(QC) the sum of both groups the standard recovered and health aware group ([RE]+[RC]) after "many" days of the start of the infection and outbreak, and assuming a health aware group represented by QC%. Hence, the avoided prevalence represented as a fraction of the prevalence that it could have been in the absence of the aware group at the end of the outbreak, is denoted as:

It is expected that this value increases, in terms of an increment in the size of the aware group, which in marginal terms means, i'(QC)>0 .
Avoided prevalence on a per capita basis: In respect of, how much the avoided prevalence per percent unit, that is the index represented, in per capita terms as:
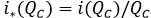
It has been proved that i* (QC) decreases its value, once the size of the aware group increases, that is, the effect for each percent unit decreases once the aware group grows in size. In mathematical terms, it can be expressed as i* (QC)<0 .
For simulation purposes, it is considered that que fS = fI = 0,1 and R0 = 1,2. The percentage of the health aware group is varied from 2% to 20%. The simulation was run, using the previous values and the outputs of i(QC) and i*(QC) were recorded on table 4.
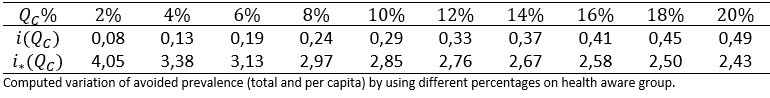 Full size
 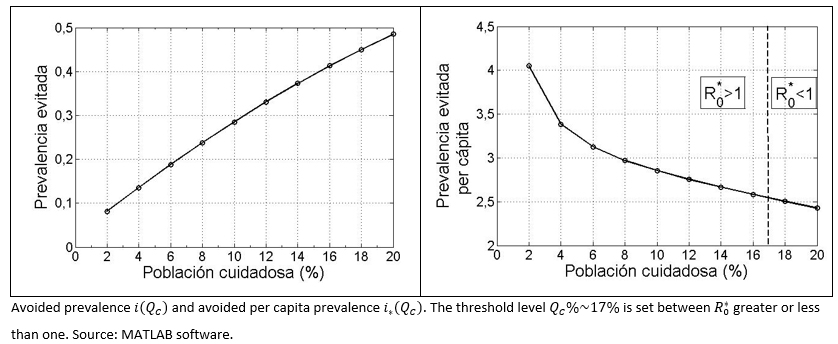 Full size
 Prevalence ratio - preventive intensity
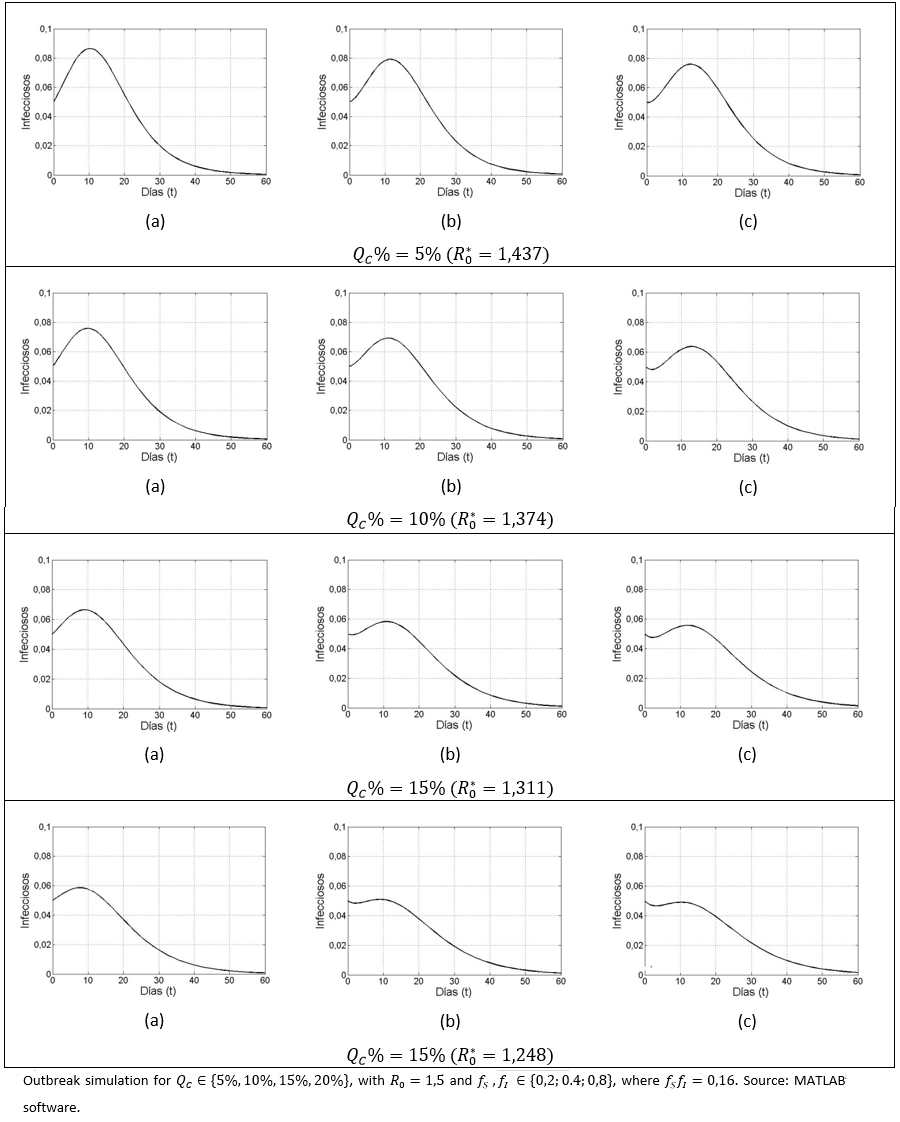
Among the considered parameters fS and fI, a diminution in fI has a greater impact on the reduction of infected cases, compared to a variation in . For different QC% (5%, 10%, 15%,20%) values, the following scenarios for the pair were considered:
(a) (0,2;0,8).
(b) (0,4;0,4) y
(c) (0,8; 0,2).
As in all cases fSfI = 0,16, we have=(1-0,84QC%) , with. Meaning that, for each QC value, across the three aforementioned cases (a-c), remains the same.
Although, given the QC value, the is observed to be the same for all the considered cases (a-c), it is also observed that prevalence decreases more significantly once the decreases, compared to a variation in . By setting (a), (b) or (c), and varying upwards, the size of the outbreak decreases, as it has already been observed. It can also be seen in the case of and (c), that an observed pattern at early stage (i.e. first few days of disease evolution) in which the infected number tends to fall; however a subsequent gentle pulse was also observed, due to the basic reproductive number being greater than unity.
 Full size
 Discussion and conclusion
Changing lifestyle (basic activities orientated to satisfy group needs) of our society, is a priority for the public health authorities[3]. However, any social change must start from a single human being and his/her lifestyle (self-regulation, aimed to better understand the social and cultural environment). In this study, a mathematical model for generic infection transmission was performed to quantify the epidemiological effect of health awareness behaviour. The findings revealed that those individuals, who perform preventive activities for their own care and the care of others, is a significant factor enable to reduce health risk within the whole population. Hence, the importance of achieving educational interventions, proposed by health bodies, targeting to promote health aware behaviours, in terms of quantity and quality. A recent study, based on mathematical approach, incorporated adaptive human behaviours to reduce infectious disease risks[8].
Social interventions orientated to achieving an appropiate distancing (reducing the contagious contact likelihood), is the greatest challenge for the modern epidemiology and the public health management. Human beings seem to show willingness to contribute with health authorities in this matter as long as the proposed measures provide them, a certain level of wellbeing[2],[3]; in this respect, adding scientific arguments, based on mathematical approach is the main contribution of this study.
The epidemiological dynamic of this research was based on crossed states structure, respect to an infectious disease (susceptible-infectious-recovered) in conjunction to behavioural compartmentalization between health aware individuals and standard individuals (distracted) facing health risk. That statement, under the assumption that every health aware individual, interacts with the environment through both factors (fS y fI ), as reduction contagion rates B%; which depends on his/her condition, acting as susceptible or infectious respectively. Comparing or measuring the potential infectiouness variation, the number of secondary cases was computed, as a result of the arrival of a first infected individual, for both cases () or () with or without health aware behavioural groups respectively. Thus, by assuming fS = fI = f , the pairs (f, QC%) are then identified, allowing a reduction at a value of non-replacement of infectious in the chain of transmission.
In practice, the mentioned goal could be achieved through an educational intervention program, able to change social parameters of QC and f which comprise . Hence, if appropriate conditions exist for the spread of the disease,>1 (undark zone in figure 1), the fact of achieving that those interventions being able to permanently increase the size of the health aware group and simultaneously decrease the contagious probability contact (ie, moving forward to the dark zone of the graph). According to Fenichel et al.[2], implementing public health policies, aimed to encourage social behaviours regarding health aware based on epidemiological distancing facing infectious risk, is one of the biggest challenges for the public health bodies.
In addition, in order to quantify the importance of the size of health aware social group, an index named avoided prevalence was defined as (i(QC)). As a result, an increase of the aforementioned index was observed, as long as the size of the health aware group increase. In contrast, a second index named the per capita avoided prevalence (i*(QC)), provide an opposite pattern compared to the previous one. It leads us to conclude, that for each health aware individual, having a lower number of fellow persons with the same behavioural type, the previous one better contributes in a per capita way to avoid future contagion.
Finally, some bibliographic evidences show that for many infectious diseases, the pathogen agent transmission occurs in relation to personal distances from person to person in a social setting[4],[11]. From an epidemiological perspective, factors of distance and frequency of physical contacts, are aspects that could be incorporated into mathematical models, in order to pressent more realistic scenarios; for instance, in our model, factors such as fS and fI would allow in a more effective manner, the construction of health intervention measures[4].
In the Key Ideas section, we recognize that the generalist approach presented in this study, is a limitation, and aspects such as age structure, immunity types, transmission mechanisms and virulence, among others, were not included. Although, those aspects deserve an special attention; the inclusion into the modeling, implies a greater complexity either in a mathematical and interpretative form, that could motivate new studies. However, in terms of the proposed objectives in this study, the presented model is good enough to understand the general implications that health aware group has over the epidemiological dynamic.
Mathematical elements
Modeling differential equation
The total population is assumed equal to one (standardize), in order to make the percentage readings. Note that for each X∈{E,C} we have [SX] + [IX] + RX] = QX% and also QE + QC = 1. The differential equations that models the process is given as
If we enter the variables [Y] defined as [Y] = [YE] + [YC], Y∈{S,I,R} we obtain
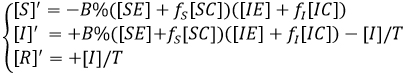
System that is transformed into the susceptible - infectious - recovered model as always when fS = fI = 1, as it is coherent not to make the aware group difference within the contagious rate.
Computing the basic reproductive number
In order to compute the basic reproductive number, techniques and notations proposed by P. Van der Driessche and Watmough[17] were used.
The system [1] is arranged so infectious groups appear on the first equations, meaning that, the vector variables system with the new arrangement is shown

where t is the transpose.
The disease-free equilibrium, is given by X*= (0,0,QE%,QC%,0,0), and the matrices F y V-1 and X*assesed on are given by:
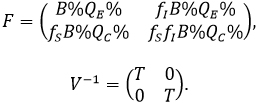
The next generation matrix, is given by FV-1 and the basic reproductive number ( ) is defined as the value of the spectral radius of the previous matrix. Where we have:
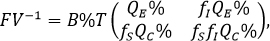
Note that the determinant of the matrix is null and therefore, the dominant eigenvalue is

Notes
From the editor
The authors originally submitted this article in Spanish and subsequently translated it into English. The Journal has not copyedited this version.
Roles and authorship contributions
FCL: conceptualization, methodology, formal analysis, research, writing (revision and edition), supervision, project management. MCH: conceptualization, research, writing (revision and edition). JPGJ: methodology, research, data management, data presentation, manuscript preparation (development of original draft), visualization.
Finantial supportive source
The authors declare no external sources of financial support.
Conflict of Interest Declaration
The authors have completed the conflict of interest declaration form from the ICMJE, and they declare not having received finantial support for the development of this study; they do not have financial relationship with any organization that could have interest in publishing this article, during the last three years; and they do not have any other relationship or involved activities that could influence the publication of this article. The forms, can be requested by contacting the responsible author or the editorial chief of this Journal.
Acknowledgments
We thanks to the Epidemiological Analysis research area of the Doctorate program in Applied Mathematical Modeling at the Universidad Católica del Maule.
