Methodological notes
← vista completaPublished on August 27, 2019 | http://doi.org/10.5867/medwave.2019.07.7687
General concepts in biostatistics and clinical epidemiology: Random error and systematic error
Conceptos generales en bioestadística y epidemiología clínica: error aleatorio y error sistemático
Abstract
Biomedical research, particularly when it involves human beings, is always subjected to sources of error that must be recognized. Systematic error or bias is associated with problems in the methodological design or during the execu-tion phase of a research project. It affects its validity and is qualitatively ap-praised. On the other hand, random error is related to variations due to chance. It may be quantitatively expressed, but never removed. This review is the first of a methodological series on general concepts in biostatistics and clin-ical epidemiology developed by the Chair of Scientific Research Methodology at the School of Medicine, University of Valparaíso, Chile. In this article, we address the theoretical concepts of error, its evaluation, and control. Finally, we discuss some current controversies in its conceptualization that are relevant to undergraduate and graduate students of health sciences.
Main messages
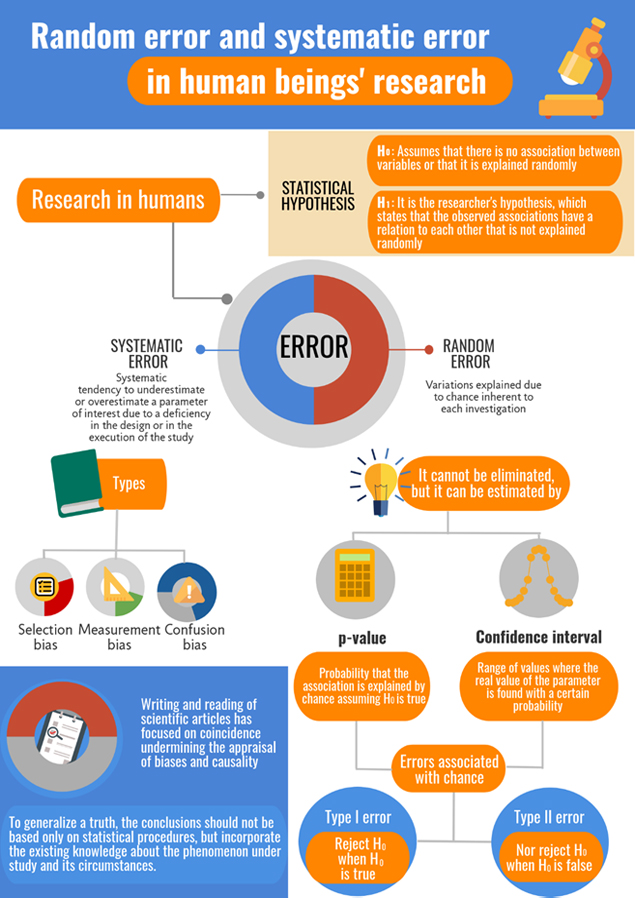
- Error is inherent in biomedical research.
- Systematic error (bias) is associated with weaknesses in methodological design or study execution that can affect the validity of the study results. It can be assessed qualitatively and avoided.
- Random error is the result of variations that occur due to chance and affect the reliability of the investigation. It can be estimated and expressed quantitatively using p-values and confidence intervals. It cannot be eliminated, but it can be controlled by using larger sample sizes and efficient statistical analysis.
- When interpreting research study conclusions, the potential effects of error (both systematic and random) should always be taken into account.
Introduction
Biomedical research, especially when conducted on human beings, is constantly subjected to errors due to the characteristics of its object of study, as well as practical and bioethical limitations. Error assessment is fundamental in the analysis of data, but mainly during the study design, which would allow anticipating the occurrence of systematic errors. Random error, on the other hand, can be expressed quantitatively according to the theory of probabilities, which allows us to estimate the effect of chance on the result of a measurement. Random error can affect the presumed representativeness (reliability) of a sample with respect to the source population, adding uncertainty and imprecision to estimates for population parameters. Given the inherent risk of systematic error and the occurrence of random error, the accuracy or validity of research results cannot be expected or assumed. The accuracy or validity of any measurement process used in research is, on the other hand, a requirement. A valid measurement process is on that is free of bias, where the difference between the estimate and the true value of a population parameter, for example, is low and reliable—that is, reproducible and consistent, or accurate, generating data with little variability among successive measurements[1],[2],[3].
Random error (which affects reliability) and systematic error (which affects validity) are two of the main elements evaluated during the development of scientific research and the subsequent critical evaluation by the readers of the published article. Because it is assumed, from a complex point of view, that the studied phenomena are always multicausal and multivariate, considering an association as true and, even more, declaring it as “causal,” implies the combination of results from different disciplines and always requires the integration of its context.
This review is the first release of a methodological series of six narrative reviews about general topics in biostatistics and clinical epidemiology. Each article will cover one of six topics based on content from publications available in the main databases of scientific literature and specialized reference texts. In this first review, we analyze different theories and practical elements associated with error in biomedical research, emphasizing its evaluation and control. Finally, we review the current perspectives regarding their theory and some controversies regarding their conceptualization.
Preliminary concepts
A hypothesis is a tentative answer to a research question. In the case of the statistical hypothesis, the construction is based on two assumptions: the null hypothesis (H0) and the alternative or alternate hypothesis (H1). H0 assumes there are no statistically significant differences between specified populations, variables, or other phenomena in the world (and that any apparent differences are due to sampling errors) and therefore inductive inferences (generalizations) about any relationship(s) between them are wrong—that is, the exposure and outcome factors are not related to each other. It is a conservative hypothesis posed in contrast to H1, the research or work hypothesis, which asserts that observed associations between different phenomena are not explained by chance[4].
The declaration of a null and an alternative hypothesis is essential in inferential statistics, where hypotheses contrast tests are applied to find sufficient evidence to reject the null hypothesis and to support the hypothesis under investigation. However, it should always be kept in mind that the result of a hypothesis test is just one more element for decision making[5] (Example 1)[6].
Systematic error (bias)
Systematic error or bias can be understood as the systematic tendency to underestimate or overestimate the estimator of interest because of a deficiency in the design or execution of a study[7]. This bias undermines the study’s validity (internal or the degree of agreement between the study results and the true value of the population parameter, and external or the degree to which the results for one study sample can be extrapolated to other populations)[2]. Biases can be associated with any phase of a research study but tend to skew the results in the same direction[2].
Biases that result in overestimation of the magnitude of association between variables are described as positive ("against" the null hypothesis) and biases that reduce the magnitude of an association are described as negative ("in favor" of the null hypothesis). In an extreme case, bias can trigger the inversion of an association, causing, for example, a protective factor to appear as a risk factor; this form of error is called “switch-over bias”[3],[8].
When it comes to research with human beings, systematic error is controlled through the study of epidemiology, using the appropriate methodological designs and data collection strategies[2]. There are many different types of bias (https://catalogofbias.org/)[9],[10] but they usually fall into three main categories: selection, measurement (or information), and confusion[4]. Selection bias occurs when the relationship between exposure and outcome changes across different groups of study participants (that is, there are systematic differences between the characteristics of the participants)[8] (Example 2).
Regarding measurement bias, it has three different forms: bias in the measured phenomenon (for example, memory bias due to differential recall of exposure in a case-control study), bias in the measuring instrument (for example, changes over time in diagnostic criteria), and bias of the observer who makes the measurement[1]. Confusion bias occurs when errors occur in the interpretation of associations between dependent and independent variables due to inadequate control of other variables in the research protocol. The different types of biases will be described in more detail in future articles in this series on the various methodological designs in which they occur most frequently. Due to its complexity and ubiquity, confusion bias will be covered in several reviews in the series.
A confounding variable is one that is associated with both the exposure variable (without being a result of it) and the outcome variable (regardless of its association with the exposure variable) but is not found in the causal path of association[11],[12]. This skews or “confuses” the association between exposure and outcome[1]. Confounding variables should not be mistaken for interaction variables that operate as “modifiers of the effect” (those that interact with the exposure variable by modifying the magnitude of its effects on the outcome but are not the cause of the outcome itself)[1].
Researchers should be aware that confusion bias is complex, prominent, and multifactorial[4]. It can be prevented at the study design level (for example, randomization in randomized clinical trials) or controlled during data analysis (stratified analysis or statistical regression models, for example)[4]. Example 3 describes the effect of confusion bias in an observational study conducted in Norway by Strand et al.[12],[13].
Random error (chance)
Random error is associated with variations resulting from chance that are inherent in all research and cannot be eliminated; this type of error can therefore influence results, even when biases have been properly controlled[7], and compromise the reliability of the investigation. Three main factors are associated with random error in study results[14]: the degree of individual and inter-individual variability, the sample size, and the magnitude of the differences (with the likelihood of it being caused by chance falling as the difference found in the comparison increases).
Observations that deviate from the true value of a variable in any sense are attributed to random error[2]. Random error is unpredictable but can be reduced by using larger sample sizes and efficient statistical analysis[14]. This reduction implies that statistics control random error[2], and that probability is related to the chance occurrence[7]. Therefore, adequate estimation of the sample size should counteract the effect of chance in the study. It should be noted, however, that a study’s sample size would not be an indicator of its internal validity. In other words, sample size is not directly associated with the level of bias of a research investigation[14]. Estimation of random error is carried out through two procedures: hypothesis contrast tests (p-value) and confidence intervals[15].
P-value
The value of p (probability) is the likelihood of observing an apparent outcome, assuming that the null hypothesis is true. That is, the p-value is the probability of chance occurrence in the case that the null hypothesis is true (assuming that the phenomena under study are not related)[4]. The p-value answers the question “What is the probability of finding that association just by chance?” It is also a measure of the strength of the evidence against the null hypothesis[14], as it can be understood as the probability of obtaining certain results given that the hypothesis that the researcher “wants” to reject is fulfilled. Therefore, intuitively, if the p-value is very small, the null hypothesis is rejected, and the research hypothesis is achieved[16].
Traditionally, the value of p is 0.05 (that is, when applying statistical methods that analyze the probability of occurrence, the associations have happened due to chance no more than 1 in 20 times, or 5% or less of the times)[4]; this suggests a probability that the null hypothesis will be rejected by mistake 5% of the time. However, there is no scientific reasoning behind the value 0.05 in itself; it is an arbitrary convention[17]. This cutoff point is referred to as “statistical significance” (the value at which the null hypothesis can be rejected). This does not necessarily indicate that something important (“significant”) has happened but should be interpreted as a calculation showing that something “meaningful” has happened[4],[18]. Some current initiatives have proposed lowering the threshold of the level of significance from 0.05 to 0.005[19].
Different hypothesis tests are linked to different p-values; the proper choice of p-value depends on the study design and random variables. All are a function of the difference between the values observed in the study and those that would be observed if the null hypothesis were true, given the variability of the sample[15]. Another way of representing p-values is as fractions whose denominators (variability of the result) decreases as the sample size increases and numerators increase when the difference between the observed values and the expected values is greater[14].
Based on the information above, there are two types of errors associated with chance. The first is the type I error, conceptualized as the probability of rejecting H0 given that H0 is true. This occurs when a study outcome suggests an association between variables that does not really exist. Thus, the statistical significance mentioned above constitutes the limit of type I error, whose numerical value is called α[20]. This type of error is found most frequently in clinical studies that seek to analyze a large number of associations simultaneously. Examples include a cohort study that analyzes multiple variables for the same exposure, a clinical trial with different subgroup analyses, and a case-control study that explores countless risk factors together[20].
On the other hand, when there is an association, but the difference is not investigated by the study, a type II error occurs. This represents the probability of not rejecting H0, since H0 is false. The symbol for a type II error is β. The complement of β (1-β) corresponds to the statistical power of the study (the probability of finding a difference, if it exists, in other words, verifying the research hypothesis). The power of a study is usually 0.8 to 0.9, meaning that it is 80% to 90% likely to detect the proposed difference, and that the result has statistical significance[20]. Example 4 shows the interpretation of the p-value in a study of biomarkers in severe mental disorders[21].
The question of whether the p-value depends on the sample size, with small samples more vulnerable to random error than larger ones, has been the subject of extensive debate. This is the reason for some of the strongest criticism of the use of hypothesis tests (the idea that the rejection of a hypothesis depends on sample size[22], since the study conclusions will be limited if only a small portion of the population is evaluated, but the rejection of the null hypothesis would be virtually assured if a large part is evaluated)[22]. However, some authors oppose this criticism, claiming that, when studying discrepancies in results of randomized clinical trials with large and small sample sizes, the differences found are not explained by sample size but by the control of biases, especially confusion bias. For this reason, the general rule would be mostly concordance between results and not the differences[14],[23]. Due to the limited amount of information that the p-value can provide on its own, another way to quantify chance is using confidence intervals.
Confidence intervals
Confidence intervals consist of a range of values in which the real value of the parameter can be determined with a certain probability[7]. Therefore, confidence intervals reflect the degree of uncertainty. As already mentioned, a larger sample will result in a more precise confidence interval for estimation of a population parameter (that is, a narrower range of values, indicating a lower effect of chance on the estimate). Like the estimation of the p-value, the estimation of the confidence intervals requires statistical inference, since a critical value in the interval that indicates the lack of association between two variables is excluded. In the case of indicators whose formula is a quotient (for example, relative risk and odds ratio), this value is 1, and when the indicators’ formula is derived by subtracting the risk of one group from the risk of another (for example, absolute risk reduction), the value is 0. In both cases, the values represent the points at which an event is equally likely in both groups[18]. Values that exceed the limits of the confidence interval may not always be entirely excluded, but it would be reasonable to think that it is highly unlikely to find the actual value of the parameter beyond these limits[24]. Example 5 shows the interpretation of the confidence interval based on the results of the study by Strand et al. cited in Example 3[13].
Perspectives and final considerations
Considering an association as “true,” in other words, not explained by bias or chance, implies thinking about causality[25], integrating what is known thus far about the mechanism underlying the phenomenon under study. This encourages us to use new approaches rather than interpreting statistical associations superficially, which entails more complexity in our thinking, given various problems pointed out below.
In order to extrapolate a result found in a sample at the population level (that is, generalize based on a certain outcome), the conclusions must not only be based on a statistical procedure or on the level of representativeness of the sample with respect to the population but must also incorporate existing knowledge about the phenomenon under study[26]. Causality should be studied considering the previous findings of other studies in the field. However, the possibility of integrating these findings into the analysis itself cannot be accurately measured.
The analytical process associated with statistical inference through hypothesis tests excludes some important factors, such as biological plausibility and the body of existing evidence. Different approaches have emerged as alternatives to this process, including Bayesian methods[27]. Bayesian methods integrate previous experiences in the inferential process, since it is assumed that cumulative experience applying a certain hypothesis can and should contribute to its verification[16]. Here, the researcher expresses aprioristic points of view probabilistically, and these are added to the formal data analysis[28].
Although the Bayesian approach is not yet widely used in biomedical research[16], there is extensive research on it, with positive results. In the meantime, even though this approach has the same theoretical framework as the p-value (the frequentist approach to probability), scientific publications have promoted use of the p-value, with confidence intervals for at least three decades[29],[30]. Confidence intervals are based on the same statistical framework as p-values but provide more information about difference between outcomes and chance in the measurement process[22].
Many scientific articles have focused on the p-value, which, as mentioned above, is a quantitative mechanism for assessing chance. According to some authors, even scientific research has focused on chance4. This has occurred at the expense of critical evaluation of biases, whose assessment is qualitative. Given a theory that, on the one hand, sheds light on which methodological designs are conducive to each type of bias, and, on the other hand, interprets the study findings in the context of what is already known about the phenomenon, it is worth asking in what sense and to what extent could bias have affected these results? Can I believe what I see? That is, the results are not reliable on their own; their value depends on the accuracy of the measuring processes that derived them.
 Full size