Review article
← vista completaPublished on January 4, 2022 | http://doi.org/10.5867/medwave.2022.01.002528
Respondent-driven sampling: Advantages and disadvantages from a sampling method
Respondent-driven sampling: ventajas e inconvenientes de un método de muestreo
Abstract
This article summarizes the main elements, advantages, and disadvantages of Respondent-driven Sampling (RDS). Some criticisms regarding the feasibility of the inherent assumptions, their point estimators, and the obtained variances are pointed out. This article also comments on the problems observed in the quality of reports. Surveys using RDS should be methodologically sound as they are being applied to define priorities in health programs and develop national and international policies for financing service delivery, among other uses. However, there is considerable potential for bias related to implementation and analytical errors. There is limited empirical evidence on how representative the results obtained by RDS are, and the quest to improve the methodology is still in progress. Nevertheless, to have confidence in RDS results, we must verify that the social structure of the networks conforms to the assumptions required by the theory, that the sampling assumptions are reasonably fulfilled, and that the quality of the report is optimal, particularly for methodological and analytical items.
|
Main messages
|
Introduction
The Respondent-driven Sampling (RDS) method is an alternative to address the limitations of studying hidden or hard-to-reach populations. This non-probability sampling method approximates probability sample design, allowing to extrapolate results to the target population [1].
The term "hard-to-reach population" began in the early 1990s in public health to refer to low socioeconomic and low literacy groups, ethnic minorities, and those not successfully reached by health communication campaigns [2].
Social science researchers coined the term "hidden population" [3] to designate those groups with no sampling frame. This situation can occur either because they belong to stigmatized social groups (e.g., men who have sex with men), due to illegal behaviors (e.g., injecting drug users), small population size, among others.
This paper summarizes alternative sampling methods targeting hard-to-reach or hidden populations. Also, we discuss the strengths and theoretical bases of the RDS strategy, its implementation, and the assumptions of the model and estimators. We also address data analysis and research quality in studying particular hard-to-reach populations, and finally, some criticisms of its inferential capacity.
Alternative sampling methods
Standard sampling techniques require the researcher to select the sample so that each member of the target population has a known, non-zero probability of being selected [4]. This requirement means that researchers must have a sampling frame, i.e., a list of all target population members. The impossibility of obtaining probability samples in "hidden populations" prompted the development of alternative methods. The main characteristics of some sampling techniques applied to the investigation of hidden or hard-to-reach populations are outlined and briefly described below:
- Snowball sampling [5] is a chain reference sampling frequently used in qualitative sociological research without inferential purposes. The method produces a sample through referrals made among people who share or know others who possess some characteristics of interest.
- Facility-based sentinel surveillance corresponds to a type of sampling that has been applied in populations involved in illegal activities, such as correctional institutions, drugs users, or engage in sex work [6].
- Key informant sampling is designed to reduce response bias by selecting people with specific knowledge about the topic under study and are asked about the group behavior rather than their own [7].
- Venue Based Time-location sampling is characterized by fieldwork (ethnographic mapping) to construct a sampling frame that identifies the times when members of the hidden population gather in a specific place before data collection [8].
- Targeted sampling attempts to move away from sampling in close institutionalized populations using several outreach techniques to attract people from a hidden population in a given urban area (street-based outreach) [3].
These alternatives to random probability sampling are considered convenience samples. Consequently, they suffer from selection biases, making it impossible to obtain unbiased estimators of a disease's prevalence and its risk factors.
Respondent-driven sampling
Theoretical basis
RDS is a chain-reference sampling technique developed by Douglas Heckathorn in the 1990s. Chain-referencing methods are those by which a data tracing path is obtained from one person to another, based on their relationship consecutively. Thus, a chain is constituted to visualize a link between the individuals [9].
The RDS method combines aspects from snowball sampling, stochastic Markov chain modeling, and the theory of biased networks (homophily model) [1]. Like the chain reference techniques, the authors rely on the theory describing the "small world" phenomenon. This theory states that each person indirectly associates with another person through approximately six intermediaries, no matter how big the network [10]. If this premise were true, it would mean that even the most socially isolated individuals can be reached in the sixth wave of a reference chain, starting from any arbitrarily chosen individual. Other theoretical bases from the "small world" phenomenon come from sociology – particularly from behavioral theories that study obedience or social control based on a sanction or by the group of belonging [11]. This theoretical background justifies the idea of incentive and peer involvement in recruitment.
The statistical theory on which RDS is based is explained in depth in Heckathorn's seminal paper published in 1997 [1]. Briefly, there are two theorems concerning regular Markov processes that apply to RDS. The first states that as recruitment chains grow, the sample structure becomes less dependent on the initially selected seeds, thus overcoming any bias that the non-random choice of seeds may have introduced. The second establishes that the sample generated with RDS approaches equilibrium geometrically fast. The author claims that this method can approximate probabilistic sample design, allowing to infer from hidden or hard-to-reach populations. Therefore, unbiased indicators and estimators of their precision can be derived if the non-probability sampling process can be modeled sufficiently. In other words, RDS would allow approaching a simple probability sampling through an intermediate step. This step consists of reconstructing the composition of the population using information from the participants' personal networks (Figure 1).
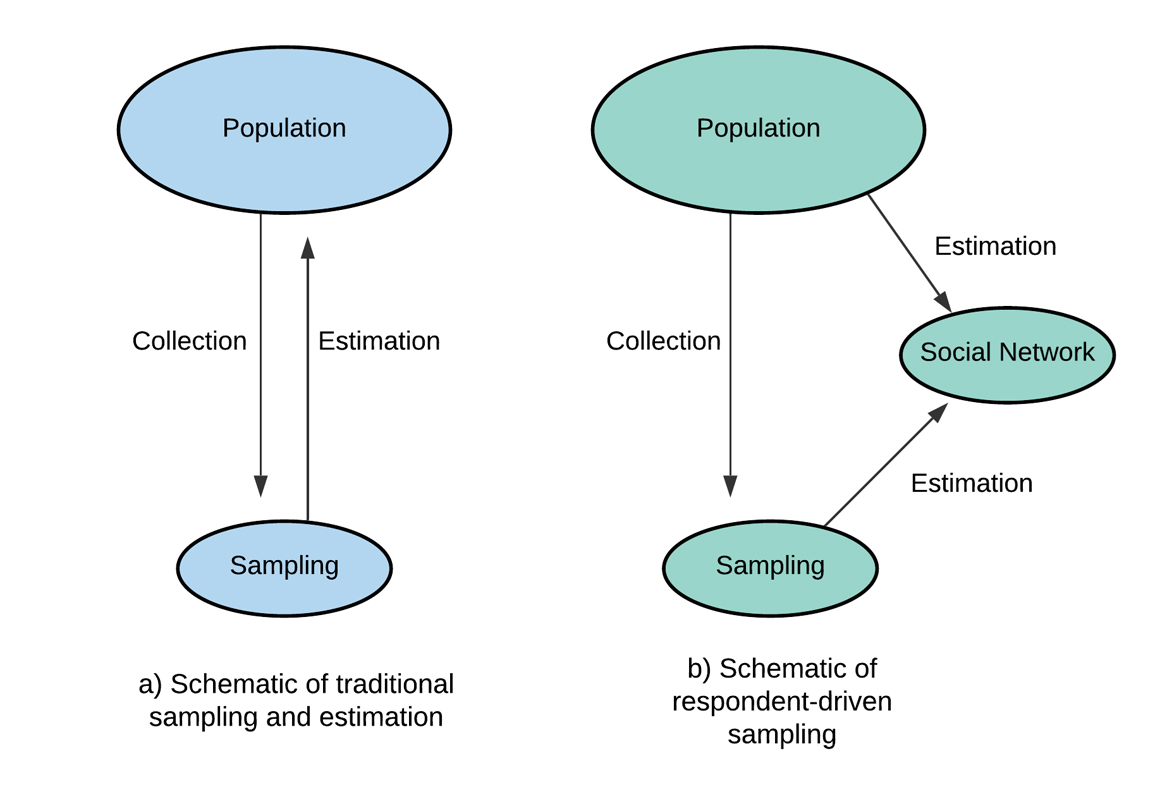 Full size
 The adequacy of the model has been tested with data from empirical studies and computational simulations with mixed results [12],[13],[14]. This aspect is further discussed in the following sections.
Implementation
Operationally, RDS recruitment begins with the intentional (non-random) selection of a certain number of initial participants or seeds from the target population. The set of seeds can be referred to as "wave zero" [1]. However, surveys using this tool are recommended to pass through "formative evaluation" first. Formative evaluation is conducted before the actual sampling and survey begin. In this step, researchers conduct focus groups, in-depth interviews, mapping the target population and the people who work with them (where appropriate) to learn more before the survey begins [15].
Once the seed completes the study's activities, they are compensated with an "initial incentive" and then asked to recruit a predetermined number of peers (usually two to three) using coupons. The seed is rewarded with a "secondary incentive" if the peers to whom he gave the coupons are successfully recruited [15]. New recruits engage others, which are offered the same initial and secondary incentives. In this way, a chain of successive waves is generated until saturation or the desired sample size is reached [15]. The use of coupons that identify recruiters and enrollees by unique alphanumeric codes means no personal data is collected. The latter aspect ensures the confidentiality of participants' identities, thus facilitating the recruitment of naturally anxious individuals to maintain their anonymity [15].
When RDS began to be used, there was confusion and a tendency to refer to this type of sampling as snowball sampling erroneously. This aspect needed to be clarified. RDS differs from the snowball technique in two fundamental ways. First, RDS gives incentives for participating and recruiting, whereas snowballing sampling only gives incentives for participating. Second, in RDS, the recruits personally invite new participants, whereas in snowballing, the recruits only identify potential new participants who are then contacted by the research team [1],[8].
The authors of RDS argue that these differences provide some advantages. They decrease the masking bias that protects eligible persons (e.g., friends) by not recruiting them directly; and decrease the "voluntariness" bias when people self-select themselves to participate in a research study. Similarly, it is argued that the use of a limited number of vouchers per participant restricts the possibility of overrepresentation of those with more extensive networks [1].
Recently, RDS surveys deployed on the internet (webRDS), where recruitment is conducted by email, followed by a survey that is completed on a designated website [12],[16],[17]. Keeping in mind RDS biases, it is not easy to ensure the quality and veracity of the data through its online application, even when implemented under the best possible conditions. For the time being, experience with this sampling method is limited and needs further evaluations to validate this modality.
Model assumptions and estimators
To make estimates from a sample generated by the recruits, we must first make certain assumptions about the population under study and how recruitment occurs. We can see how biases flourish when assumptions are not regarded by making these explicit. The initial assumptions, described by the authors of the method [8] were:
- The recruits recognize each other as members of the target population, and therefore, the ties are reciprocal. (An example of a hidden population unsuitable for RDS would be the tax-evading population, which is not naturally interconnected.)
- A network links the recruits with a single component. This means that the ties must be dense enough to sustain the referral chain.
- Sampling occurs with replacement so that successive recruitments do not deplete the pool of potential future recruits.
- The recruits accurately report the size of their personal network – i.e., the number of relatives, friends, or acquaintances who meet the criteria of the target population. (This assumption is essential because, with this information, each participant's network is reconstructed probabilistically.)
- The recruits are randomly selected among the members of the recruiter's network.
- Each recruiter enrolls only one of their peers into their network.
Some of these assumptions have evolved. For example, assumption number six disappeared when adjustments were made for the bias associated with differential recruitment. But the main assumptions – which are at the heart of the theory underlying RDS (assumptions one, four, and five) – are solid assumptions that need to be verified to avoid unreliable inferences.
Analysis
The analysis of the data generated with RDS has two aspects. The first is the dynamic analysis of the sample obtained. And the second, after the desired sample size has been reached, consists of calculating the variables' estimators of interest, their confidence intervals, and the design effect.
In chain reference techniques, particularly with RDS, it is necessary to closely monitor the evolution of recruitment concerning its size and evolution towards equilibrium. We explain this notion further below.
The monitoring of recruitment is done with the help of graphs representing the recruitment tree produced with each new wave. These graphs allow the identification of unproductive seeds and help assess the need to start new seeds or increase the incentive to integrate underrepresented groups. Another helpful tool is the graphs that make it possible to visualize when the sample is approaching equilibrium, wave by wave. This enables the interruption of chains in a coordinated and harmonious manner.
The sample analysis consists of verifying that the sample's composition has reached equilibrium and that the level of homophily of the groups is adequate. These aspects are explained below:
Equilibrium
This refers to verifying whether the Markov model fits the data (model diagnosis). Equilibrium is done empirically by comparing the composition of the obtained and theoretically expected sample, under the assumption that the sampling corresponds to a Markov process. More specifically, equilibrium would be reached when the sample composition of each additional wave remains stable [1]. Equilibrium is considered acceptable when the discrepancy is less than 2% between the calculated theoretical equilibrium and the actual sample composition in each of the sample's constituent subgroups (e.g., race, gender, location).
Homophily
This refers to the tendency to recruit participants who belong to the same group. Perfect homophily occurs when all ties are formed within a group (a value of + 1 is assigned). In contrast, heterophily occurs when all ties are formed outside the group (a value of - 1 is assigned) [18]. Groups with high homophily tend to be overrepresented in the obtained sample, so post-stratification statistical techniques should weigh them.
Finally, inferential statistical analysis of the data obtained involves calculating point estimators of the characteristic of interest (e.g., prevalence, proportion of risk factors in the population). This is carried out using one of the adjustment methods developed by theoretical researchers in RDS. The different approaches used by each are not the subject of this review. Suffice it to know the best known are three approaches. The first, identified by its acronym RDS-HK1 [18], was later refined to RDS -I [8]. The second, RDS-II, emerged in 2008 [19]. And the most recent, RDS-SS, was developed to reduce the bias introduced when the assumption of sampling without replacement is not respected, i.e., when the sampling fraction is large [13].
Regarding calculating confidence intervals, Heckathorn proposed a method in 2002 that uses a unique form of bootstrapping that considers the differences in homophily existing between groups. It is worth noting that as homophily increases, the standard error increases exponentially. Likewise, as standard error increases, the required sample size also increases [18].
Estimators associated with the point estimators indicated above have been developed. For example, Salganik Boostrap-Sal-BS [20] is typically used with RDS-I and II point estimators. In contrast, Succesive Sampling Bootstrap-SS-BS is used with the point estimator of RDS-SS [13].
From the variance-bootstrap estimators, confidence intervals can be calculated in two ways: the percentile method, which can generate asymmetric intervals around the point estimator, and the t student's method, which always produces symmetric intervals [21]. A systematic review summarizing the various point and variance estimators associated with RDS can be consulted [22].
It is essential to underline that the data obtained with RDS come from observations that are not independent (specifically, from pre-existing networks or relationships). This is why they require specific techniques different from those used with data obtained by simple probability sampling. As we have seen, there are different methods for calculating point estimators and their variances. Unfortunately, there is no consensus as to which of the available estimators have the best properties, and much research is being carried out to improve the quality of the estimators [13],[14].
Softwares
The creators of the RDS technique developed a software – the RDS Analysis Tool (RDSAT, available at www.respondentdrivensampling.org) – that allows monitoring the sampling and implementing the statistical analysis with ease. Another software is RDS Analyst (www.hpmrg.org), created by researchers in the Hard-to-Reach Population Methods Research Group. Other softwares, such as NetDraw, allow designing graphs of the networks formed during sampling. Also, users of R statistical software can install the RDS package recently developed by the Hard-to-Reach Population Methods Research Group. All of the above software is publicly available at no cost.
It is essential to note that the STrengthening the Reporting of OBservational studies in Epidemiology - RDS, STROBE-RDS (discussed below) states: "if an existing software is used, provide the version number and specific analysis settings used to facilitate interpretation of results and replication of analysis methods. Similarly, if custom-written software is used, the code should be made available to researchers upon request." It is important to emphasize that it is not sufficient to indicate the software used, but details of the specifications must also be provided. For example, the software menu may ask population size, the number of iterations for the bootstrap, and the estimators they chose for the calculations.
Reported uses and populations
One of the main uses of RDS is the estimation of the prevalence of some variable in a population. This sampling technique was initially applied to groups of people at high risk of HIV infection, particularly men who have sex with men, injecting drug users, and commercial sex workers. Subsequently, use was expanded to other populations.
Recently, RDS has been widely used and has gained the endorsement of organizations such as the United States Centers for Disease Control and Prevention [23], the Joint United Nations Program on HIV/AIDS, the World Health Organization, the Global Fund, and others. These institutions have used it to establish baseline measurements and trends of HIV prevalence and other infections, risk behaviors, program impact through biological and behavioral surveys. Other populations that have been studied using RDS include immigrants [24],[25],[26], jazz musicians [27], and transgender people [28].
Other uses, such as estimating the size of the target population, have been little explored [29]. For the time being, RDS is not recommended for this purpose, especially if options such as census or capture-recapture are available and the assumptions necessary for its use are justified [30],[31].
Reporting quality of studies using RDS
In 2015, an extension of the STROBE guideline [32] was published, which is the internationally recognized standard for correct and complete reporting of observational studies in epidemiology. This STROBE extension for RDS [33] became necessary after a small exploratory study showed that publications using this method suffered severe shortcomings. For example, the authors indicated that only one-third of the required information was present, and vital sampling and data analysis elements lacked essential details. These included the seed selection method, the number of recruits per seed, the exact wording of the network size question, and how participants were trained to recruit their peers, among others. To accommodate studies applying RDS, the drafters of the STROBE-RDS guide introduced modifications to 12 of the 22 items in the STROBE checklist for cross-sectional studies. Table 1 lists the 12 added or modified items, briefly explaining each item's expectations.
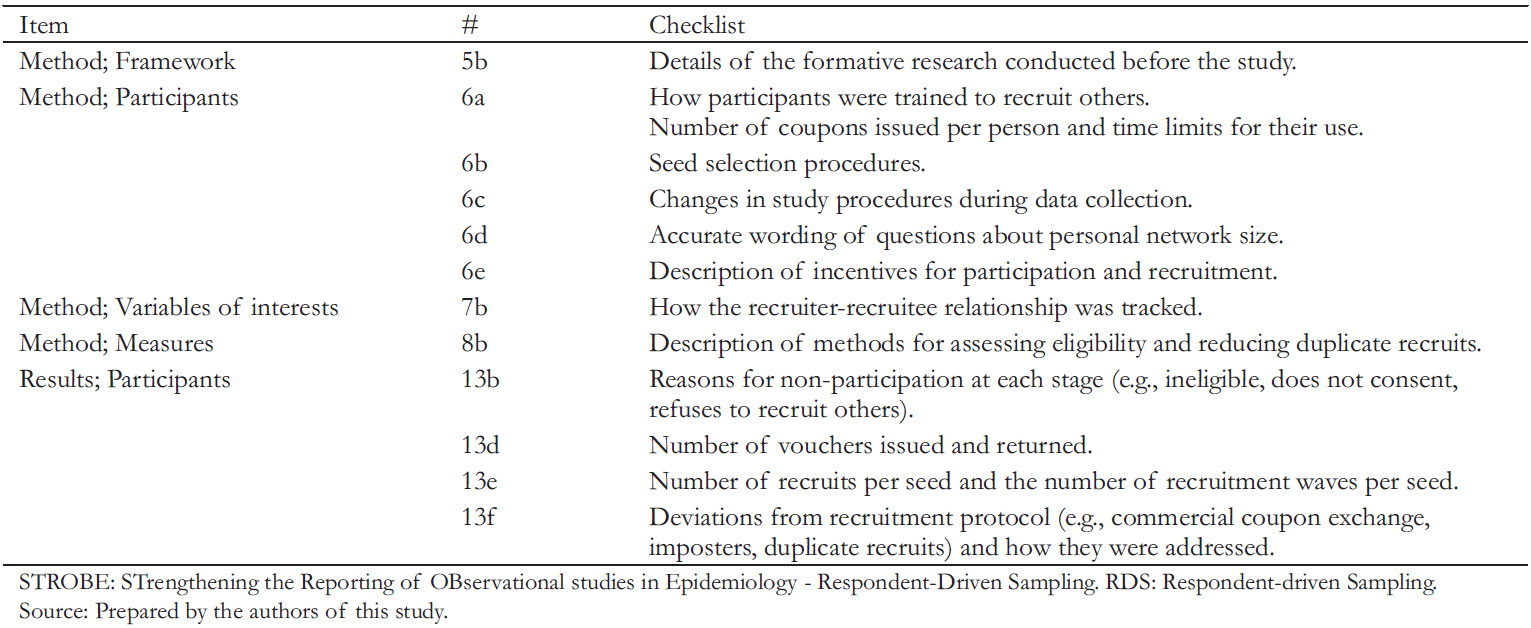 Full size
 A systematic review published in 2016 [34] was interested in how the essential items defined by STROBE-RDS were reported, evaluating studies published up to 2013 that used RDS. This work also provides an overview of the extent and diversification of this sampling method in the scientific medical literature. The systematic review identified 151 peer-reviewed English-language articles that estimated prevalence (excluding methodological articles). These articles described 222 surveys conducted in five regions of the world.
The authors are the same ones who led the development of STROBE-RDS, so their conclusions are very similar. They stress that the absence of information on the methodological and analytical items of RDS makes it challenging to assess the quality of the studies and the robustness of the results. This sampling method is not valid for all situations, and the efforts made to meet the assumptions must be detailed. For example, only 43% of the surveys reported the maximum number of waves, and only 20% reported whether equilibrium or convergence was reached (data necessary to assess potential biases). Most of the studies included in this systematic review were from North America and Europe, so it would be interesting to see results from other regions.
Criticisms of the inferential power of RDS
With the increasing application of RDS in various contexts and countries, skepticism has arisen regarding the real-world fulfillment of the underlying model assumptions. A frequent problem arises when the process fails to achieve the desired sample size because the chains are interrupted after only a few waves. Often an attempt is made to mitigate the undesired effect by adding new seeds. According to Malmros, 43% of the RDS studies reviewed reported initiating new seeds [35].
Gile is an author who has published extensively on the theory behind RDS. In the paper where he proposed a new estimator, which bears his name, he discusses the notion that the estimators proposed by Volz and Hackethorn [19] are "asymptotically unbiased" [36]. He argues that there are three main areas in which deviations from ideal conditions can introduce biases. The first involves the selection of seeds for convenience, the second involves the behavioral aspects of the recruiter/recruit, and the third corresponds to deviations from the random walk model.
A relatively recent study on injection drug users [37] evaluated some assumptions underlying the RDS theoretical model. The great merit of this study is that the authors scrupulously collected sociometric data from the participants' networks. In addition, detailed and in-depth information was collected regarding the behavior of recruits and recruiters. It should be remembered that one of the central assumptions of RDS is that the recruiter selects their peers randomly from within their social network of contacts. The authors observed that almost half of the participants redistributed coupons on the street, that there were no uniform behavioral patterns of recruiters (in choosing and approaching recruits and passing the coupons), and nor of the enrollees (in accepting/rejecting the coupons, in declining to participate). In all, the authors conclude that central assumptions of RDS are violated. These assumptions include random selection, the probability of recruitment proportional to the size of the participant's network, and recruitment occurring between reciprocal ties within the network, among others.
Briefly, the issue underlies in assuming that, using the current estimators, the sampled individuals always respond, recruit other individuals when solicited, and recruit randomly among their acquaintances. In practice, sampled individuals may not respond (non-response rate), may not consistently recruit others (imperfect recruitment effectiveness), and may preferentially invite individuals with particular characteristics and not at random (differential recruitment). For example, if the incentive is compelling, they may preferentially recruit within a family (homophily). On the contrary, if the ordinary activity is dangerous, they may recruit strangers, thus violating the reciprocity assumption.
Most advocates and critics of RDS believe that this tool should be considered a potentially superior form of convenience sampling. However, caution is required when interpreting its findings.
Conclusions
Surveys using RDS should be methodologically sound as they are being applied to define priorities in health programs and develop national and international policies for financing service delivery, among other uses.
However, this method has considerable potential for bias related to implementation and analytical errors. Empirical evidence on how representative the results obtained by RDS are is limited. The quest to improve the methodology is still in progress. Therefore, it is essential to ensure transparency and accuracy in reporting studies using RDS to acquire more confidence in using this method.
Many RDS aspects have been barely studied. In our opinion, incentives need to be further explored, as not all hidden populations respond to moderate monetary incentives, and some may not respond at all. Likewise, the issue of calculating sample size is confusing or, at least, circular. If the size of the population is not known, it is not possible to make such a calculation. Similarly, when calculating the design effect, it is necessary to consider the variance observed if simple probability sampling were performed. It is debatable to recommend a design effect equal to two, as the authors of STROBE-RDS do when the experiences show large variability. Finally, the costs necessary to conduct RDS also deserve more attention. A design effect of two or more would increase the sample considerably, adding costs of prior formative research, which is nowadays considered indispensable.
RDS is a popular method because it effectively recruits people who might be reluctant to participate in research. In the absence of better methods for reaching hidden populations, this type of sampling will probably continue to be used. Freely available software has likely influenced this sampling method's success and widespread use. Nevertheless, to have confidence in RDS results, we must verify that the social structure of the networks conforms to the assumptions required by the theory, that the sampling assumptions are reasonably fulfilled, and that the quality of the report is optimal, particularly for methodological and analytical items.
Notes
Contributor roles
MSN: conceptualization, methodology, research, manuscript preparation (development of the original draft). CA: conceptualization, research, writing (revisions and edits). VCB: conceptualization, methodology, supervision, fund acquisition, research, revisions, and edits.
Funding
This work was funded by the Universidad de Santiago de Chile (USACH), through the InvClínica _DICYT Project, Code 021991BNNC_MED, of the Vicerrectoría de Investigación, Desarrollo e Innovación.
Competing interests
The authors completed the ICMJE conflict of interest statement and declared that they did not receive funds for the realization of this article; they have no financial relationships with organizations that may have an interest in the published article in the last three years and have no other relationships or activities that may influence the publication of the article. The forms can be requested by contacting the responsible author or the Editorial Committee of the Journal.
Ethics
This study did not require evaluation by an ethics committee because it worked on secondary sources.
Language of submission
Spanish.
