Estudios originales
← vista completaPublicado el 3 de abril de 2023 | http://doi.org/10.5867/medwave.2023.03.2667
Estimación de la eficiencia del uso de pabellones electivos en el sistema de salud público chileno entre 2018 y 2021
Efficiency estimation on the use of elective surgical theaters in the Chilean public health system from 2018 to 2021
Abstract
Objective The efficient use of wards intended for elective surgeries is essential to resolve cases on the surgical waiting list. This study aims to estimate the efficiency of ward use in the Chilean public health system between 2018 and 2021.
Methods The design was an ecological study. Section A.21 of the database constructed by the monthly statistical summaries that each public health network facility reported to the Ministry of Health between 2018 and 2021 was analyzed. Data from subsections A, E and F were extracted: ward staffing, total elective surgeries by specialty, number and causes of suspension of elective surgeries. Then, the surgical performance during working hours and the percentage of hourly occupancy for a working day was estimated. Additionally, an analysis was made by region with data from 2021.
Results The percentage of elective wards in use ranged from 81.1% to 94.1%, while those enabled for those staffing ranged from 70.5% to 90.4% during 2018 and 2021. The total number of surgeries was highest in 2019 (n = 416 339), but for 2018, 2020, and 2021 it ranged from 259 000 to 297 000. Suspensions varied between 10.8% (2019) and 6.9% (2021), with the leading cause being patient-related. When analyzing the number of cases canceled monthly by facility, we saw that the leading cause was trade union-related. The maximum throughput of a ward intended for elective surgery was reached in 2019 and was 2.5 surgeries; in 2018, 2020 and 2021, the throughput borders on two surgeries per ward enabled for elective surgery. The percentage of ward time occupied during working hours by contract day varies between 80.7% (2018) and 56.8% (2020).
Conclusions All the parameters found and estimated in this study show that there is an inefficient utilization of operating rooms in Chilean public healthcare facilities.
Main messages
- Efficient use of wards for elective surgery is key to resolving waiting lists.
- The length of waiting lists is used as an indicator of unmet needs, inadequate resources, or administrative inefficiencies.
- This work contributes to the knowledge of the factors that will allow the development of national and regional strategies to improve ward efficiency, directly impacting surgical waiting lists in the Chilean reality.
- The limitations of this work are related to the type and consistency of the data routinely collected by the Department of Health Statistics and Information.
Introduction
The surgical waiting list is a valid indicator and patient compilation tool that shows the excess demand for medical services over the available supply in a geographic area. The waiting list length is often used as an indicator of unmet needs, inadequate resources, or administrative inefficiencies. Waiting lists are inherent to any healthcare system where direct payment does not provide access to a physician’s medical assistance [1]. Even before the pandemic, it was a problem for world-renowned healthcare systems such as that of the United Kingdom [2].
According to the latest report of the Ministry of Health, 260 135 people (59.2% women) were on the surgical waiting list as of March 31st, 2021, corresponding to 291 207 interventions. That same report gives an average waiting time of 558 days, i.e., 1.5 years [3]. The most frequent pathology on the waiting list was cholecystectomy, followed by knee arthroplasty, with a median waiting time of 2.5 years [4].
Strategies have been proposed for prioritizing surgical waiting lists based on national strategies and implemented according to local circumstances. In addition, general principles should be followed, incorporating parameters based on specialty and pathology [5]. However, increased efficiency in using wards for these pathologies is a strategy that has been little studied in Chile. Estay et al. [6] showed that pathologies excluded from the Explicit Health Guarantees Law (GES) have heterogeneous and higher waiting times than those reported by countries belonging to the Organization for Economic Cooperation and Development (OECD). In addition, they proposed strategies to solve this problem, emphasizing the strengthening of primary care but without considering better management of the use of wards for elective surgeries [6].
The provision and use efficiency of elective surgery wards are crucial for resolving cases on the surgical waiting list. There is no single parameter to define ward efficiency [7]. Pandit et al. [8] defined ward efficiency as the combination of three factors: maximizing the use of scheduled time in a day, minimizing the number of prolonged wards, and minimizing suspensions. On the other hand, Macario [7] proposes to determine efficiency according to six parameters: delay in the start of the first surgery, cost per ward hour, percentage of wards with a turnover time greater than 60 minutes, turnover time, ward use in relation to staff time, and the ratio between the estimated time and the actual surgery time.
The Chilean Public Health System wards are for emergency, gynecological-obstetric, elective, and undifferentiated care. Emergency wards are intended to resolve pathologies consulted in emergency services or complications of hospitalized patients. The gynecological-obstetric wards are intended for interventions in this specialty, mainly deliveries. The elective wards are used to resolve pathologies that, given their nature, allow the surgery date to be programmed in advance, being the usual way of resolving cases on the surgical waiting list. Undifferentiated wards are used to treat emergency or elective pathologies and are a strategy used by centers with a low volume of emergency pathologies. According to the Manual of Monthly Statistical Summaries of the Chilean Ministry of Health, it is not recommended to designate wards in this modality to high complexity centers [9].
Identifying gaps makes it possible to diagnose the current situation and define strategies for improvement [10]. Knowing the daily throughput of surgical wards for elective surgeries, the number of hours occupied, and the causes of cancelations will help define national and regional strategies to improve the efficiency of wards, with a direct impact on surgical waiting lists [11]. The COVID-19 pandemic has been a significant cause of a decline in elective surgeries and ward occupancy. A recent study showed that the incidence of knee arthroplasty (the second leading cause of surgical waiting list) decreased by more than 60% during the first year of the pandemic [12]. However, there are several publications guiding a safe return to performing elective surgeries with results similar to the pre-pandemic era [13,14,15]. Therefore, it would be expected that in 2021 ward efficiency will be similar to pre-pandemic.
The overall objective of this study is to estimate the efficiency of ward use in the Chilean public health system between 2018 and 2021. First, we describe the provision of elective wards, the number of surgeries performed, and the number and cause of cancelations. Then, the efficiency of the use of elective wards will be estimated using as parameters the percentage of occupancy of elective ward hours available in working hours, the number of daily surgeries per elective ward, and the percentage of cancelations between 2018 and 2021.
Methods
Ecological study. We analyzed the database constructed by the Monthly Statistical Summaries (REM) that each Chilean public health network facility reported to the Ministry of Health between 2018 and 2021. These are available in the open data of the Department of Statistics and Information in Health (DEIS) (
-
Subsection A: installed capacity and utilization of operating rooms.
-
Subsection E: process management of surgical patients with elective surgery.
-
Subsection F: causes of cancelation of elective surgeries.
The monthly data for these three subsections were extracted using the ACCESS program (Microsoft®). The exploratory data analysis showed no missing data and only inconsistency in the percentages of authorized and occupied wards (less than 5%). In the case of finding an occupancy or habilitation above 100% of the staffing, it was considered inconsistent data. It was agreed among the authors to consider this data as 100% occupancy or habilitation. This bias only affects the results of part "a" and does not affect the other results.
Qualitative variables were reported in absolute frequencies and percentages; quantitative variables were reported as mean and standard deviation. The data were processed in the STATA v17 program. The analysis of the work was divided into five parts:
a. Staffed wards
The Monthly Statistical Summaries series methodological guide [9] defines "staffed wards" as those reported by resolution, installed, and available for use in accordance with the Regional Secretariat of the Chilean Ministry of Health, with no fluctuation in the number of wards for temporary reasons. Meanwhile, authorized wards correspond to those with the infrastructure and equipment available to function, and active or working wards correspond to those authorized with human resources. Both authorized and active wards show monthly fluctuations in their number. The data for this analysis were extracted from subsection A, which corresponds to "Staffed wards": "staffed wards", "average monthly number of authorized wards", "average monthly number of functioning operating rooms (referred to as "active") and "total monthly number of operating ward hours". This last variable is reported for both working and non-working hours. According to the Monthly Statistical Summaries methodological guide [9], the working hours are of 8.75 hours from Monday to Friday, with these hours being broken down between 8 a.m. and 5 p.m. from Monday to Thursday and from 8 a.m. to 4 p.m. on Fridays. Non-working hours correspond to the use of the ward from Monday to Thursday from 5:00 p.m., Fridays from 4:00 p.m., or the use of wards on holidays and weekends. In addition, in subsection A, each of the variables reported is broken down by type of use assigned to the ward: elective, emergency, obstetric, and undifferentiated.
b. Total number of surgeries and surgeries by subspecialty
Data from subsection E were used for this category. These data are broken down into the following subspecialties: general surgery, cardiovascular surgery, maxillofacial surgery, thoracic surgery, traumatology, neurosurgery, otolaryngology, ophthalmology, obstetrics and gynecology, gynecology, urology, and other specialties. "obstetrics and gynecology" and "gynecology" were grouped at the time of analysis. This section details the number of elective surgeries; however, it was impossible to know whether they were performed during working or non-working hours or the type of ward in which they were performed. The monthly statistical summary report does not have a section detailing the number of emergency surgeries.
c. Cancelation of elective surgeries from 2018 to 2021
This item uses data from subsection F, which details the absolute number of cancelations by cause category in each institution by month. The causes of cancelation are grouped into the following categories: "patient", "administrative", "clinical support unit", "surgical team", "infrastructure", "emergencies," and "union". Table 1 details the categories of cancelation causes according to the Methodological Guide for the Monthly Statistical Summary series [9].
The percentage of cancelations was calculated using the absolute number of cancelations as the numerator, the sum of the absolute number of surgeries, and the absolute number of cancelations as the denominator. It was observed that not all institutions reported cancelations in each category. To estimate the impact of each cause of cancelation, these were summed and then divided by 12 and by the number of institutions reporting that cause. This indicator was called "average monthly cancelation per institution": average monthly cancelation per cause = ((number of cancelations in a year for cause "i"/12 months)/number of institutions reporting cause "i").
d. Estimated elective ward throughput from 2018 to 2021
For this estimation, it was assumed that all reported elective surgeries, except for gynecological surgeries, were performed in wards intended for elective surgery. This is an optimistic approach since it assumes that undifferentiated wards were used only for emergency surgeries. On the other hand, it is assumed that the operating output is homogeneous, i.e., that the surgical output in elective surgeries per hour is the same during working hours as during non-working hours. Finally, the number of available elective wards was used for this estimation, not the total number of available wards (staffed).
First, the number of gynecological surgeries was subtracted from the total number of reported elective surgeries since these are performed in gynecological wards, not elective wards. Given that the number of facilities reporting the provision and use of wards does not match the number of facilities that report the number of elective surgeries, the number of elective surgeries performed in facilities that report the number of available elective wards ("cxest") was estimated using the following formula: cxest = (number of elective surgeries/number of facilities reporting elective surgeries) * (number of facilities reporting authorized elective wards).
Next, the number of hours needed for each elective surgery performed ("hrcx") was calculated by dividing the total effective occupation hours in elective surgeries (skilled and unskilled) by the "cxest": hrcx = total hours occupied in elective surgeries/cxest.
The effective hours are those spent in the surgery itself, i.e., excluding ward turnover time (cleaning, anesthesia of the patient).
On the other hand, the number of effective working hours spent in elective wards was used for elective surgeries (without gynecological). Again, given that the number of facilities reporting staffed wards and use does not match the number of facilities reporting elective surgeries, the number of working hours was estimated as follows: tothabilest = ((effective working hours in institutions reporting wards * institutions reporting surgery)/(institutions reporting staffed wards).
Next, we calculated the mean daily amount of effective occupation hours of an authorized ward by dividing the “tothabilest” estimator by the total number of authorized wards and by the number of working days of the year: hrhabilest = tothabilest/authorized wards/working days of the year.
Finally, to estimate the number of daily elective surgeries performed per authorized ward on a working day ("ward throughput"), hrhabilest was divided by hrcx: ward throughput = hrhabilest/hrcx.
In addition, the total effective time of surgery during working hours reported and the total time spent on preparation during working hours were added, obtaining the proportion of time in relation to that spent on preparation:
Proportion of ward preparation hours during working hours = total hours spent on ward preparation during working hours/(total hours of elective ward effective use during working hours + total hours spent on elective ward preparation during working hours).
This time was added to the estimated number of daily ward hours. With this, the effective ward occupancy in a working day was calculated, which according to the Monthly Statistical Summaries methodological guide, is of 8 hours and 45 minutes per day (45 minutes corresponds to ¾ of an hour, therefore 8.75):
Percentage effective ward occupancy = ((daily surgery hours during working hours + (daily surgery hours in skilled hours * proportion of preparation hours during working hours))/working day 8.75).
e. Analysis by region 2021: staffing and suspensions
For this purpose, parts "a" and "c" were analyzed for each region of the country in 2021.
Results
a. Staffed wards from 2018 to 2021
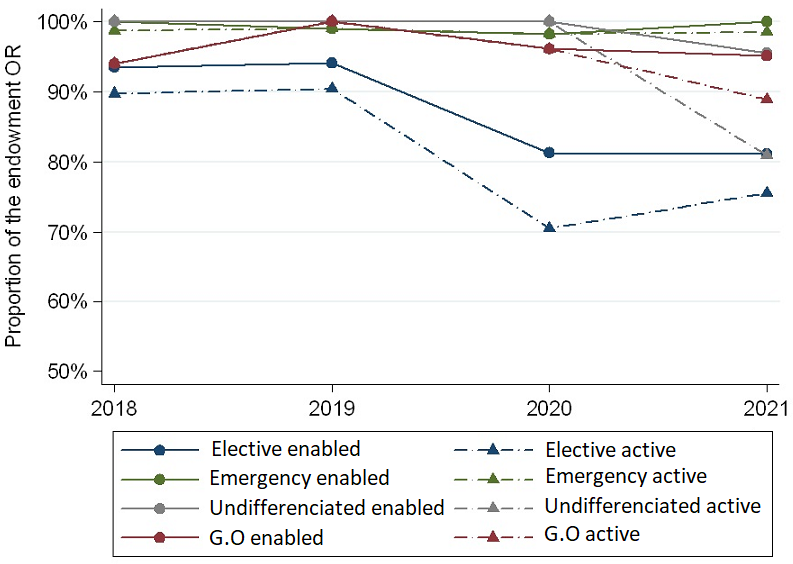
The total number of wards varied from 679 in 2018 to 695 in 2021. Out of the total number of wards in our country, those destined for elective surgery accounted for 73.9% in 2018; 74.1% in 2019; 74.3% in 2020, and 76.1% in 2021. The percentage of authorized wards is lower in elective wards than in the other types of wards, the difference being greater in 2020 and 2021, where the percentage was 81.1% and 81.3%, respectively (Figure 1). For active wards, this percentage is even lower. In 2018 and 2019, it was reported that 90% of the wards were active, while in 2020 and 2021, only three out of four were active (Figure 1).
Percentage of enabled and active wards by type and year compared to the total number of wards.
G.O = Gynecological-obstretic.
b. Total number of surgeries and surgeries by subspecialty from 2018 to 2021
The total number of elective surgeries was higher in 2019 (n = 416 339), performed in 99 facilities. Similar numbers were reported in 2018 and 2021, reaching 297 000 surgeries. However, in 2021 four additional facilities reported the number of surgeries.
The largest proportion of wards is destined for general surgery (range 26.0% to 28.2%), followed by orthopedics and traumatology (range 14.7% to 18.6%) and ophthalmology (range 12.2% to 16.1%) (Table 2).
c. Cancelation of elective surgeries from 2018 to 2021
The percentage of cancelations decreased from 12.9% in 2018 to 6.4% in 2021. When analyzing the average monthly cancelations by each center, it was estimated that 9.7 patients (SD 13.0) canceled in 2018, while 5.7 (6.8) in 2021 (Table 3).
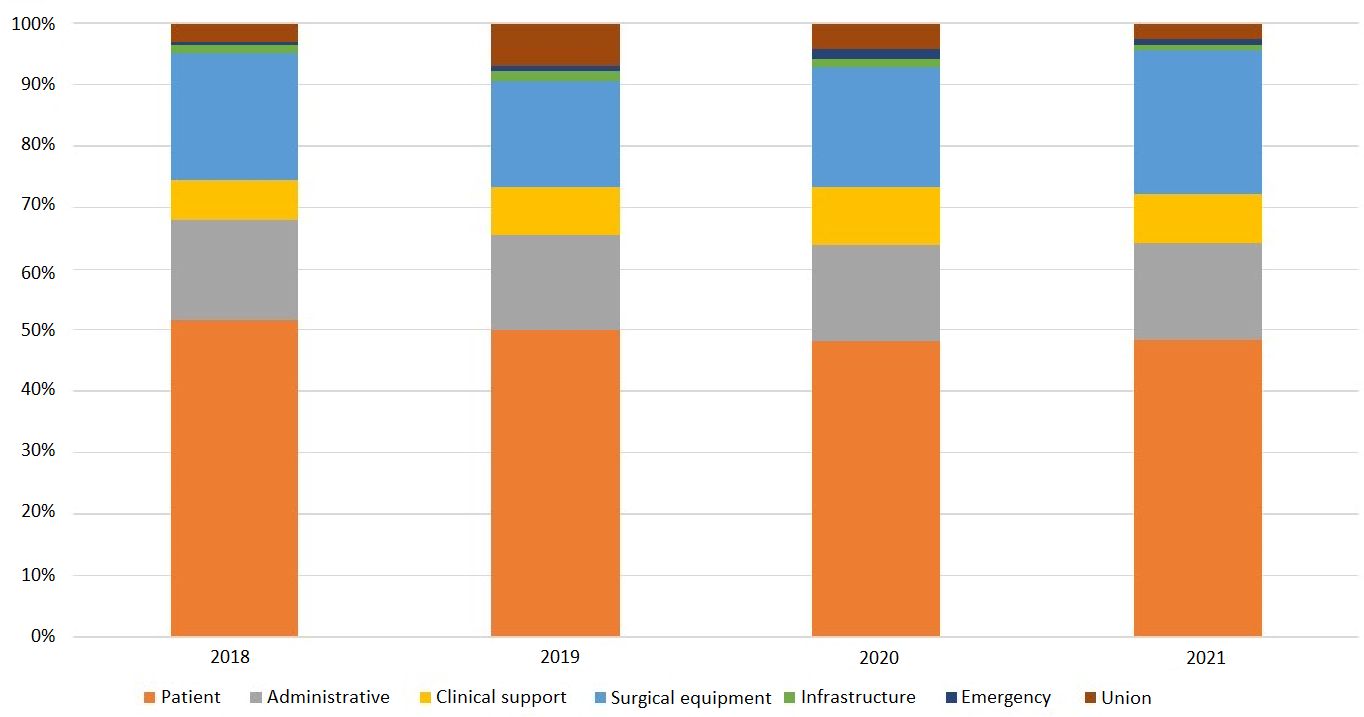
An analysis of the total number of cancelations revealed that the cause "patient" is the most common, accounting for almost half. Problems with the "surgical team" was the second cause (one in every five cancelations) (Figure 2).
Percentage of the total number of cancelations per year by cause.
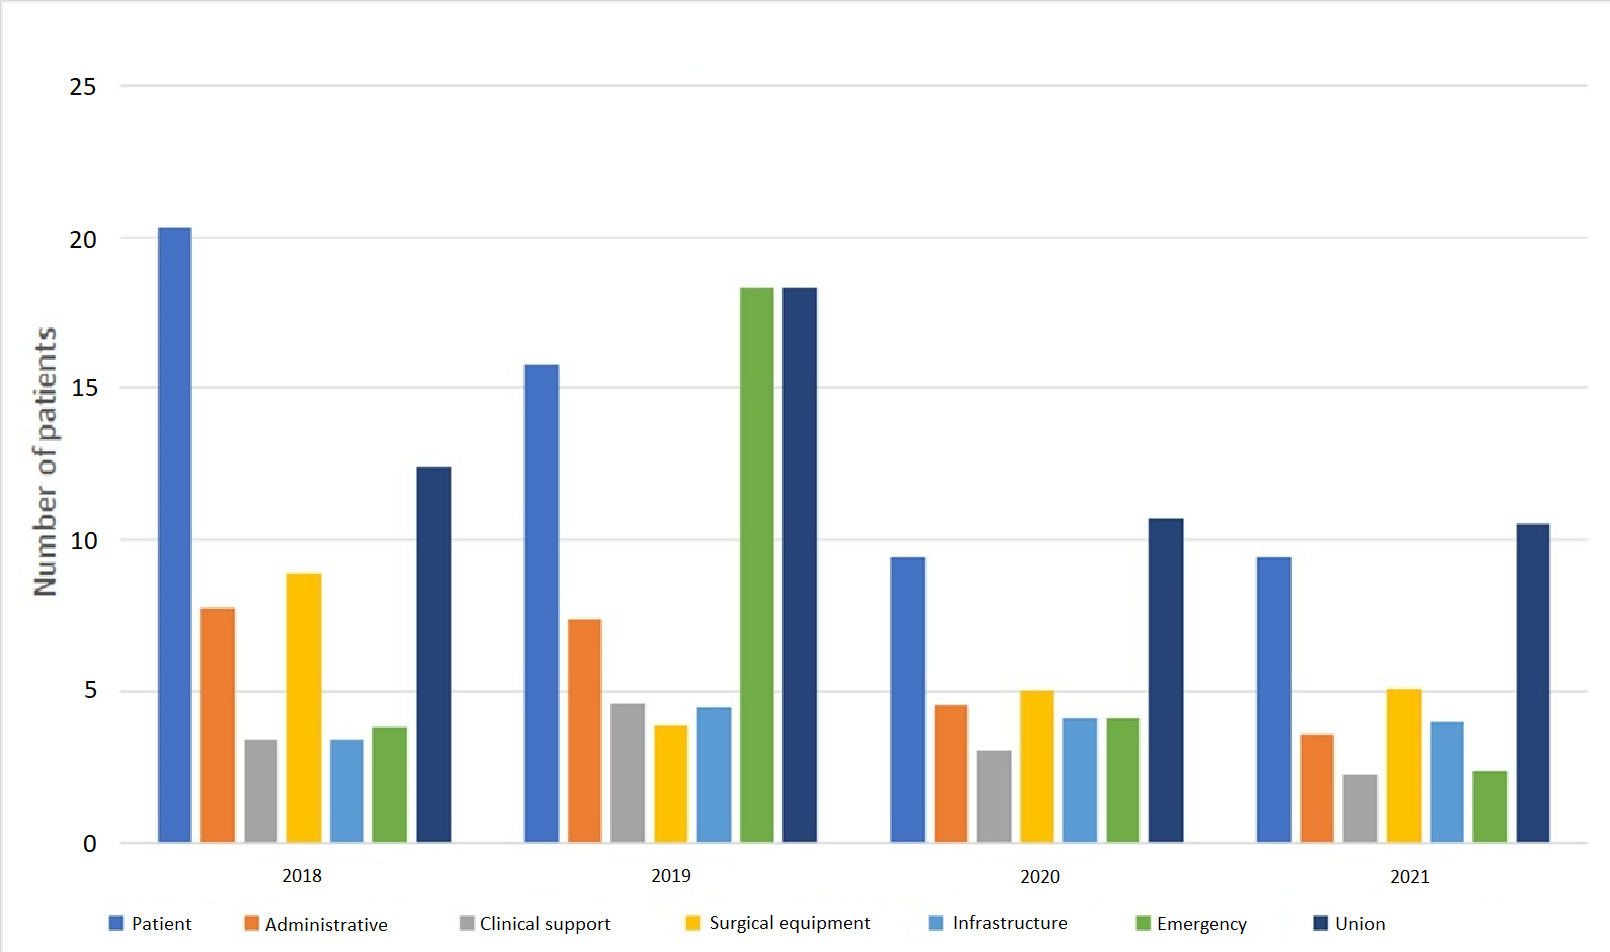
However, when analyzing the indicator "average monthly number of cancelations per institution", it is observed that the cause "union" has a higher number of cancelations per month since 2019, ranging between 11 in 2021 and 18 in 2019. In 2018 it ranked second, surpassed by "patient" (Figure 3). This difference regarding the total number of cancelations is due to the underreporting of this cause; the "patient" cause is reported in all centers, but the "union" cause was only reported in 25% of facilities in 2021 and 61% in 2019.
Shows the indicator "average monthly cancelations per reporting facility" in each facility by cause and by year.
d. Estimated elective ward throughput from 2018 to 2021
The highest throughput of elective surgeries per ward was achieved in 2019, performing an average of 2.53 surgeries a day per ward. However, in 2018, 2020, and 2021 the performance was similar, varying between 1.92 and 2.09 surgeries a day per ward (Table 4).
In 2018, the highest percentage of effective ward occupancy of a working day (80.7%) was reached. 2020 and 2021 had the lowest effective occupancy percentages, reaching 56.8% and 60.2%, respectively (Table 4).
e. Analysis by region 2021: staffing and cancelations
The largest number of wards is in the Metropolitan Region, with 200 (38%), followed by the Valparaíso Region (n = 55.10%) and Biobío (n = 52.10%). The regions of Tarapacá and Aysén have the lowest percentage of enabled and active wards, below 60% (Table 5).
The main cause of cancelation, according to the indicator "average monthly cancelations per institution" was heterogeneous across Chile’s regions. In the Atacama and Aysén regions, it was the "infrastructure" cause, while the "patient" cause was the lowest. The Antofagasta region presented the cause "patient" as the main reason in the "average monthly number of cancelations per institution" indicator. On the other hand, the cause "surgical equipment" had the highest value in the regions of Tarapacá, Coquimbo, and Magallanes. The "union" cause was reported only in the regions of Tarapacá, Coquimbo, Valparaíso, O'Higgins, Biobío, Metropolitan, and Los Ríos, exceeding 10 cancelations per month in four of them (Tarapacá, Coquimbo, O'Higgins, and Biobío) (Table 6).
Discussion
This study shows that the use of wards for elective surgeries in our country requires urgent management interventions to improve their performance and decrease the surgical waiting list. Increasing the effective use of existing wards is probably more cost-effective than investing in more infrastructure that would function in the same way as the existing ones, with a significant impact in the short term, as opposed to building more wards.
There is no single parameter to define whether a ward is efficient, so it is necessary to review the entire ward workflow, considering the health user, human resources needed for the surgery, and the available infrastructure. Regarding the latter, the first aspect detected in this study is that it is necessary to increase the proportion of available wards in relation to the number of staffed wards to maximize the use of the available infrastructure. Both emergency, obstetric and undifferentiated wards have a higher percentage of available and active wards than elective surgery wards. Probably the biggest problem during 2021 was absenteeism [16]. However, 90% of active wards in 2018 and 2019 was also lower than that reported for wards intended for other use.
On the other hand, this study shows that effective ward occupation during working hours does not exceed 80% of the working day of 8.75 hours. This means that the scheduling strategy of the wards is deficient. An efficient ward is considered when this percentage is above 90% [7], far from what was found in this analysis, even before the pandemic. The use of documented times for ward scheduling is key, so the use of technology and the implementation of algorithms that allow better use of contracted staff time are 21st-century strategies that must be implemented urgently [17,18]. Likewise, this makes it possible to optimize another efficiency parameter that could not be measured in this study: the surgeon’s underestimation of the time needed for surgery, which should not be more than 15 minutes. Again, having a record of the historical duration of surgeries, both by the team and by individual surgeons, makes it possible to define strategies for improving the use of wards. Going even deeper into this topic, each physician (surgeon and anesthesiologist) must have feedback on their actions, including delays, duration of interventions, costs associated with their procedures, and registration of complications. This will help evaluate and improve the physician’s practice, undoubtedly improving ward efficiency [19].
Although it is not considered an efficiency parameter by itself, it is striking that the estimated number of daily surgeries per ward is around two. A retrospective study in a Chilean university hospital shows a three-year throughput of 2.5 surgeries a day per ward [20], equivalent to that of 2019. In contrast, the throughput reported in 2018, 2020, and 2021 was lower than that of the university hospital. Additionally, we observe that the number of reported surgeries per year was between 250 000 and 290 000 (except in 2019). The Ministry of Health reported that the waiting list as of March 2021 was 290 000 patients. This means that while waiting for surgery, there is at least one year of surgical activity [9].
Ward turnover is another marker of ward efficiency and is related to the surgeon’s satisfaction with ward efficiency [21]. A turnover of fewer than 25 minutes is considered efficient and medium efficiency if it is less than 40 minutes [7]. From the data that could be extracted from the Department of Health Statistics and Information database, it was determined that ward preparation times range from 48 minutes (2020) to 72 minutes (2018). average is around two surgeries, implying one replacement per ward, so the time is excessive. However, it is unclear whether this includes the starting delay of the first ward, another efficiency parameter. In any case, there is evidence that the lower ward occupancy in public compared to private systems is determined by ward turnover, with no significant differences in the duration of the surgery [22]. Ward expenditure is another important indicator of efficiency. The work carried out by diagnosis-related groups in recent years has been crucial for this task, making it possible to search for strategies to obtain optimal and cost-effective clinical results in different surgical subspecialties. The self-management policy of hospitals requires reliable budgets. This is key for health centers with fixed budgets, such as the public network in Chile [7].
Another indicator of ward efficiency is the percentage of cancelations; a ward with less than 5% is considered efficient. A study conducted in a pediatric-university hospital in our country showed a surgery cancelation rate of 4%, most of which was attributable to changes in the patient’s health [23]. Whenever surgeries are canceled for any reason, efficiency is at risk, waiting time for the patient increases, quality of care is compromised, resources are wasted, and costs increase [24].
Cancelations are a problem worldwide. It has economic repercussions for the institution or health system and on the patient’s prognosis. Smith et al. in 2014 reported that cardiac surgeries with a 2% suspension rate are associated with 5% mortality in the first 30 days [25]. Additionally, it is linked to anxiety due to rescheduling, additional health expenses, decreased perception of treatment quality, and decreased quality of life [24].
To address these problems, we must identify all preventable causes. This study reports high cancelation rates, many of which could have been prevented [26]. The major cause of cancelation identified was the "patient". However, when delving deeper into the problems attributable to this cause, it is observed that many could be solved with better management: acute or chronic conditions that contraindicate surgery, lack of fasting or preparation for surgery (e.g., intestinal), altered preoperative examinations or failure to suspend anticoagulation, lack of evaluation by another specialty or incomplete preoperative studies. A unit designed to manage this could reduce cancelations considerably or anticipate them and grant the appointment to people in conditions to have the surgery.
Secondly, there is the cause of the "surgical team", which accounts for the prolongation of the scheduled surgical times. This means that surgeries took longer than scheduled or that there was a shortage of personnel. This can be solved with better management of resources, avoiding underestimation of surgical times, and reducing ward turnover time.
"Administrative" causes are in third place. It is often impossible to anticipate equipment failures here, but correct maintenance is a potential solution. In this case of cancelation, we speculate that the availability of beds in critical and recovery units may be key. Again, prior patient assessment, proper preparation, and the use of shortened inpatient or outpatient circuit units may decrease these requirements [27,28,29].
Finally, but highly worrying, is the high "number of monthly suspensions per institution" due to union causes. This aspect should be addressed, considering the working conditions of healthcare personnel and the need to avoid canceling surgeries [30]. We estimate that there is underreporting given the low proportion of institutions that mention this cause and the high number of suspensions in those that do. This could be biased, for example, by prolongation of scheduled surgical times (surgical team). It is known that the National Federation of Health Workers (FENATS) systematically holds meetings during working hours in the morning, which the health workers attend with all their rights, returning after the meeting. This prevents surgeries from starting and the previously scheduled surgical work from being carried out. Consequently, even though the patients did not undergo surgery due to the prolongation of the scheduled surgical time, the real cause is union-related. The right to manifest and group together to improve working conditions is valid. However, the cancelation of wards is a threat to the health of people who have been waiting for long periods. Likewise, the "prolongation of surgical times" cause also hides other under-reported variables, such as the staff’s delay (surgeon or anesthesiologist).
The analysis by region for 2021 shows that ward problems are not homogeneous. The regions of Tarapacá and Aysén need to increase the proportion of active pavilions. Consequently, the latter has the highest rate of cancelations due to infrastructure. Each center probably has its problems, so even though the Ministry of Health guidelines are necessary, each center should carry out interventions according to its circumstances.
The limitations of this study relate to the type and consistency of data routinely collected by the Department of Health Statistics and Information. This is valid for every health system in the world; it is reported that the instructions for collecting national statistics in England and Wales still contain anomalies and inconsistencies in the specification of data listing booked and deferred admissions and day cases [2]. Suppose we want to improve ward management. In that case, it is necessary to include in the monthly statistical summaries: the percentage of turnover times greater than one hour, the starting time of the first surgery, the percentage of wards that are extended beyond the scheduled time, the percentage of compliance with the scheduled surgical times, the percentage of schedules in relation to hired personnel and a better definition of cancelation causes, classifying them as preventable or non-preventable and a better breakdown of the "extended surgical times" section.
Finally, we strongly recommend that the quality department of each hospital be in charge of recording and managing this data, as this is currently done by the ward personnel themselves, who are both "judge and party" to the problem. This would lead to a true audit of ward operations. The efficient use of wards for elective surgeries is key to solving waiting lists. The phrase coined more than a century ago by William Thomson, "what is not defined cannot be measured, what is not measured cannot be improved, and what is not improved is always degraded," is more valid than ever [31].
Conclusions
All the studied parameters show that the use of wards in the Chilean Public Health System is inefficient and urgently requires better management to maximize the use of existing resources. It is necessary to increase the percentage of active and enabled wards, optimize the hours of use in relation to the contracted time, improve ward turnover times and address the high rate of preventable cancelations.
On the other hand, the Department of Health Statistics and Information does not have all the parameters used in the literature to evaluate ward efficiency. Improving the design of registries would be useful for implementing more interventions.
