Estudios originales
← vista completaPublicado el 3 de abril de 2025 | http://doi.org/10.5867/medwave.2025.03.3025
Análisis espacial de receptividad y vulnerabilidad a la transmisión de arbovirosis en Ecuador entre 2015 y 2019: estudio ecológico
Spatial analysis of receptivity and vulnerability to arbovirosis transmission in Ecuador between 2015 and 2019: An ecological study
Abstract
Introduction Arboviruses such as dengue, Zika and chikungunya represent a threat to public health in several South American countries, including Ecuador. Accurate identification of local risk areas and detection of critical transmission points are crucial for the effective planning of vector control programs, particularly in the management of the effectively planning vector control programs, particularly in managing mosquito. This study aimed to characterize the variables of receptivity and vulnerability to arboviral transmission at the cantonal level, and to identify hotspots in Ecuador between 2015 and 2019.
Methods Environmental and sociodemographic data at the cantonal level were used to perform a spatial analysis, which included a spatial autocorrelation analysis to identify transmission hotspots at the parish level. GeoDa software was used to detect these hotspots.
Results The provinces of Ecuador with the highest levels of receptivity and vulnerability were Manabí, Guayas, El Oro and Esmeraldas. These levels were mainly related to temperature, altitude, and limited access to clean water services. Fifty-six cantons were identified as high transmission areas. Nine parishes were classified as transmission hotspots for five consecutive years.
Conclusions The spatial analysis allowed for precisely identifying the more susceptible and vulnerable areas for arbovirus transmission in Ecuador. The persistence of transmission hotspots in certain municipalities was evidenced, influenced by environmental and sociodemographic factors. This evidence is key to adapt and improve vector surveillance and control strategies in the most affected regions.
Main messages
- The identification of receptivity and vulnerability variables is fundamental to determine high-priority areas for intervention in the control of Aedes aegypti.
- Determining the analysis of transmission hotspots allows to optimize prevention and control strategies.
- Different local geographical conditions in each canton limit the generalization of results.
Introduction
Arboviral diseases, including dengue, Zika and chikungunya, represent one of the main threats to public health in tropical and subtropical areas worldwide [1]. These diseases, transmitted mainly by mosquitoes of the genus Aedes, particularly Aedes aegypti, are influenced by environmental and socioeconomic factors determining the vector’s distribution and the dynamics of virus transmission [1,2]. It is estimated that more than 390 million dengue infections worldwide yearly [2]. In addition, an increase is projected due to climate change and unplanned urban expansion [3].
Two key concepts in understanding the risk of arbovirus transmission are receptivity and vulnerability [4]. Receptivity refers to the capacity of the environment to maintain vector populations, determined by factors such as temperature, precipitation and altitude [5]. On the other hand, vulnerability measures the susceptibility of human populations to viral exposure and transmission, influenced by socioeconomic determinants such as access to drinking water, sanitation and population density, as well as migration. The interaction between these factors generates heterogeneous transmission patterns, making vector control and preventing outbreaks difficult [6].
In Ecuador, favorable climatic conditions, geographical heterogeneity and deficiencies in the healthcare infrastructure make the country particularly vulnerable to the transmission of arboviral diseases [7]. Although vector control programs have been implemented [8], there are still limitations in their scope due to the limited coverage of personnel and the absence of an integrated geospatial approach that would allow interventions to be prioritized in areas of greatest risk. In addition, Ecuadorian administrative divisions at the canton and parish level have significant variations in their environmental and socioeconomic characteristics. This highlights the need to adapt strategies to local contexts. A canton is an intermediate administrative division between province and parish, while a parish is a smaller subdivision within a canton [9].
In the face of this problem, this study seeks to characterize the variables of receptivity and vulnerability at the cantonal level, using epidemiological, environmental and socioeconomic data. In addition, it aims to identify persistent transmission hotspots, providing key information to optimize interventions and public health resources. This analysis will provide some insight on the dynamics of arboviral transmission in the country, helping to strengthen vector surveillance and control strategies in the most affected areas. The data from this research was part of a previous study conducted as part of a master’s thesis.
Methods
An ecological study was carried out with retrospective data on the incidence of arboviral diseases (dengue, Zika and chikungunya) in Ecuador between 2015 and 2019. This design made it possible to evaluate the relationship between environmental and socioeconomic variables and the cumulative incidence of arboviral diseases at the cantonal and parish levels. It also made it possible to analyze spatial patterns of transmission in the country. The data included both environmental determinants (average temperature, rainfall and altitude) and socioeconomic factors (population density, access to drinking water and sanitation).
The cumulative incidence of arboviral diseases was defined as the number of new cases per 10 000 inhabitants, calculated for each canton and parish during the study period. The data were obtained from the Epidemiological Surveillance System (SIE-Alerta) of Ecuador’s Ministry of Public Health [10]. In addition, the environmental variables included the average temperature (in degrees Celsius), the monthly precipitation (millimeters) and the altitude (meters above sea level), obtained from the WorldClim platform [11]. On the other hand, socioeconomic variables, such as population density (inhabitants per square kilometer) and the percentage of access to drinking water, were extracted from the databases of the National Institute of Statistics and Censuses (INEC) [12]. The geographical delimitation of cantons and parishes was carried out using cartography from the Military Geographic Institute [13].
The statistical analysis included simple linear regression models to evaluate the influence of environmental and socioeconomic variables on the cumulative incidence of arboviral diseases. Regression coefficients (B), p values, and 95% confidence intervals were reported to determine the statistical significance and magnitude of the associations. The variables considered in the model were average temperature, monthly rainfall, altitude, population density, and access to drinking water.
Spatial analysis was conducted with GeoDa software (version 1.20) using Getis' Gi* statistics to identify hot and cold spots of cumulative incidence [14]. Following the objective of the analysis, only hotspots with a significance level of less than 0.05 were considered. This method evaluates whether a location and its immediate neighbors have significantly high or low values compared with the study area’s average. The spatial neighborhood matrix was defined using the Queen contiguity scheme, which considers as neighbors those areas that share edges or vertices. The Z scores derived from the Gi* statistics were interpreted according to the specific data distribution in each year. This is because it is impossible to establish a fixed standard Z value to determine significance due to the spatial and temporal variability of the data [15]. This approach ensures that the results adequately reflect the characteristics of the data analyzed each year.
The number of times a parish or canton was classified as a hotspot during the five years analyzed was added to integrate the annual results. This enabled the identification of persistent high-incidence areas, providing a clearer view of spatial patterns and their stability over time. Spatial analysis results were represented on a refined risk map using QGIS software (version 3.10). This map highlighted the frequency of hotspots at the parish level, providing a visual tool for prioritizing public health interventions [16].
This analysis has certain limitations. Ecological design limits the ability to establish direct causal relationships, and the quality of secondary data can influence the findings. Furthermore, the variability in incidence rates between years introduces complexity in identifying consistent patterns. However, using the Gi* statistics and integrating annual results provided a robust view of spatial patterns. It is recommended that future studies include entomological data and predictive models to complement and strengthen the results obtained.
The study used secondary, anonymized and publicly accessible data, which guarantees the confidentiality of the information. Because no individual-level data was collected, no specific ethics approval was required. These considerations ensure that the analysis is consistent with the ethical standards applicable to research based on population data.
Results
Simple linear regression analysis showed significant associations between environmental and socioeconomic variables and the cumulative incidence of arboviral diseases. Among the environmental variables, an increase of one degree Celsius in the average temperature was associated with an average increase of 34.8 additional cases per 10 000 inhabitants (p < 0.0005). On the other hand, a one millimeter increase in monthly rainfall was related to an average increase of 1.93 cases per 10 000 inhabitants (p = 0.001). On the contrary, a one meter increase in altitude was associated with an average reduction of 0.19 cases per 10 000 inhabitants (p < 0.0005).
In terms of socioeconomic variables, a 1% increase in access to drinking water was associated with an average decrease of 5.37 cases per 10 000 inhabitants (p = 0.012). In contrast, an increase of one inhabitant per square kilometer in population density was related to an average decrease of 0.25 cases per 10 000 inhabitants (p = 0.02) (Table 1).
The spatial analysis performed with the Getis Gi* statistic identified areas with significantly high concentrations of cumulative arboviral disease incidence, known as hot spots, compared to the parish average and its immediate neighboring areas. In the annual analyses, hot spots clustered mainly in the coastal provinces of Manabí, Guayas, Esmeraldas, and El Oro. These areas showed consistently high incidence values compared to other regions of the country.
Integrating the annual results allowed the identification of areas persistently classified as hotspots during the five analyzed years. In total, we identified nine parishes with a high recurrence of hotspots. In the province of Guayas, these parishes were Morro, Posorja, General Villamil and Puná. In the province of Manabí, the recurring parishes included Julcuy, San Lorenzo, Bahía de Caráquez, Machalilla and Santa Marianita. These areas stand out as critical zones for the sustained transmission of arbovirosis (Figure 1).
Hot spots for the risk of arbovirus transmission in Ecuador.
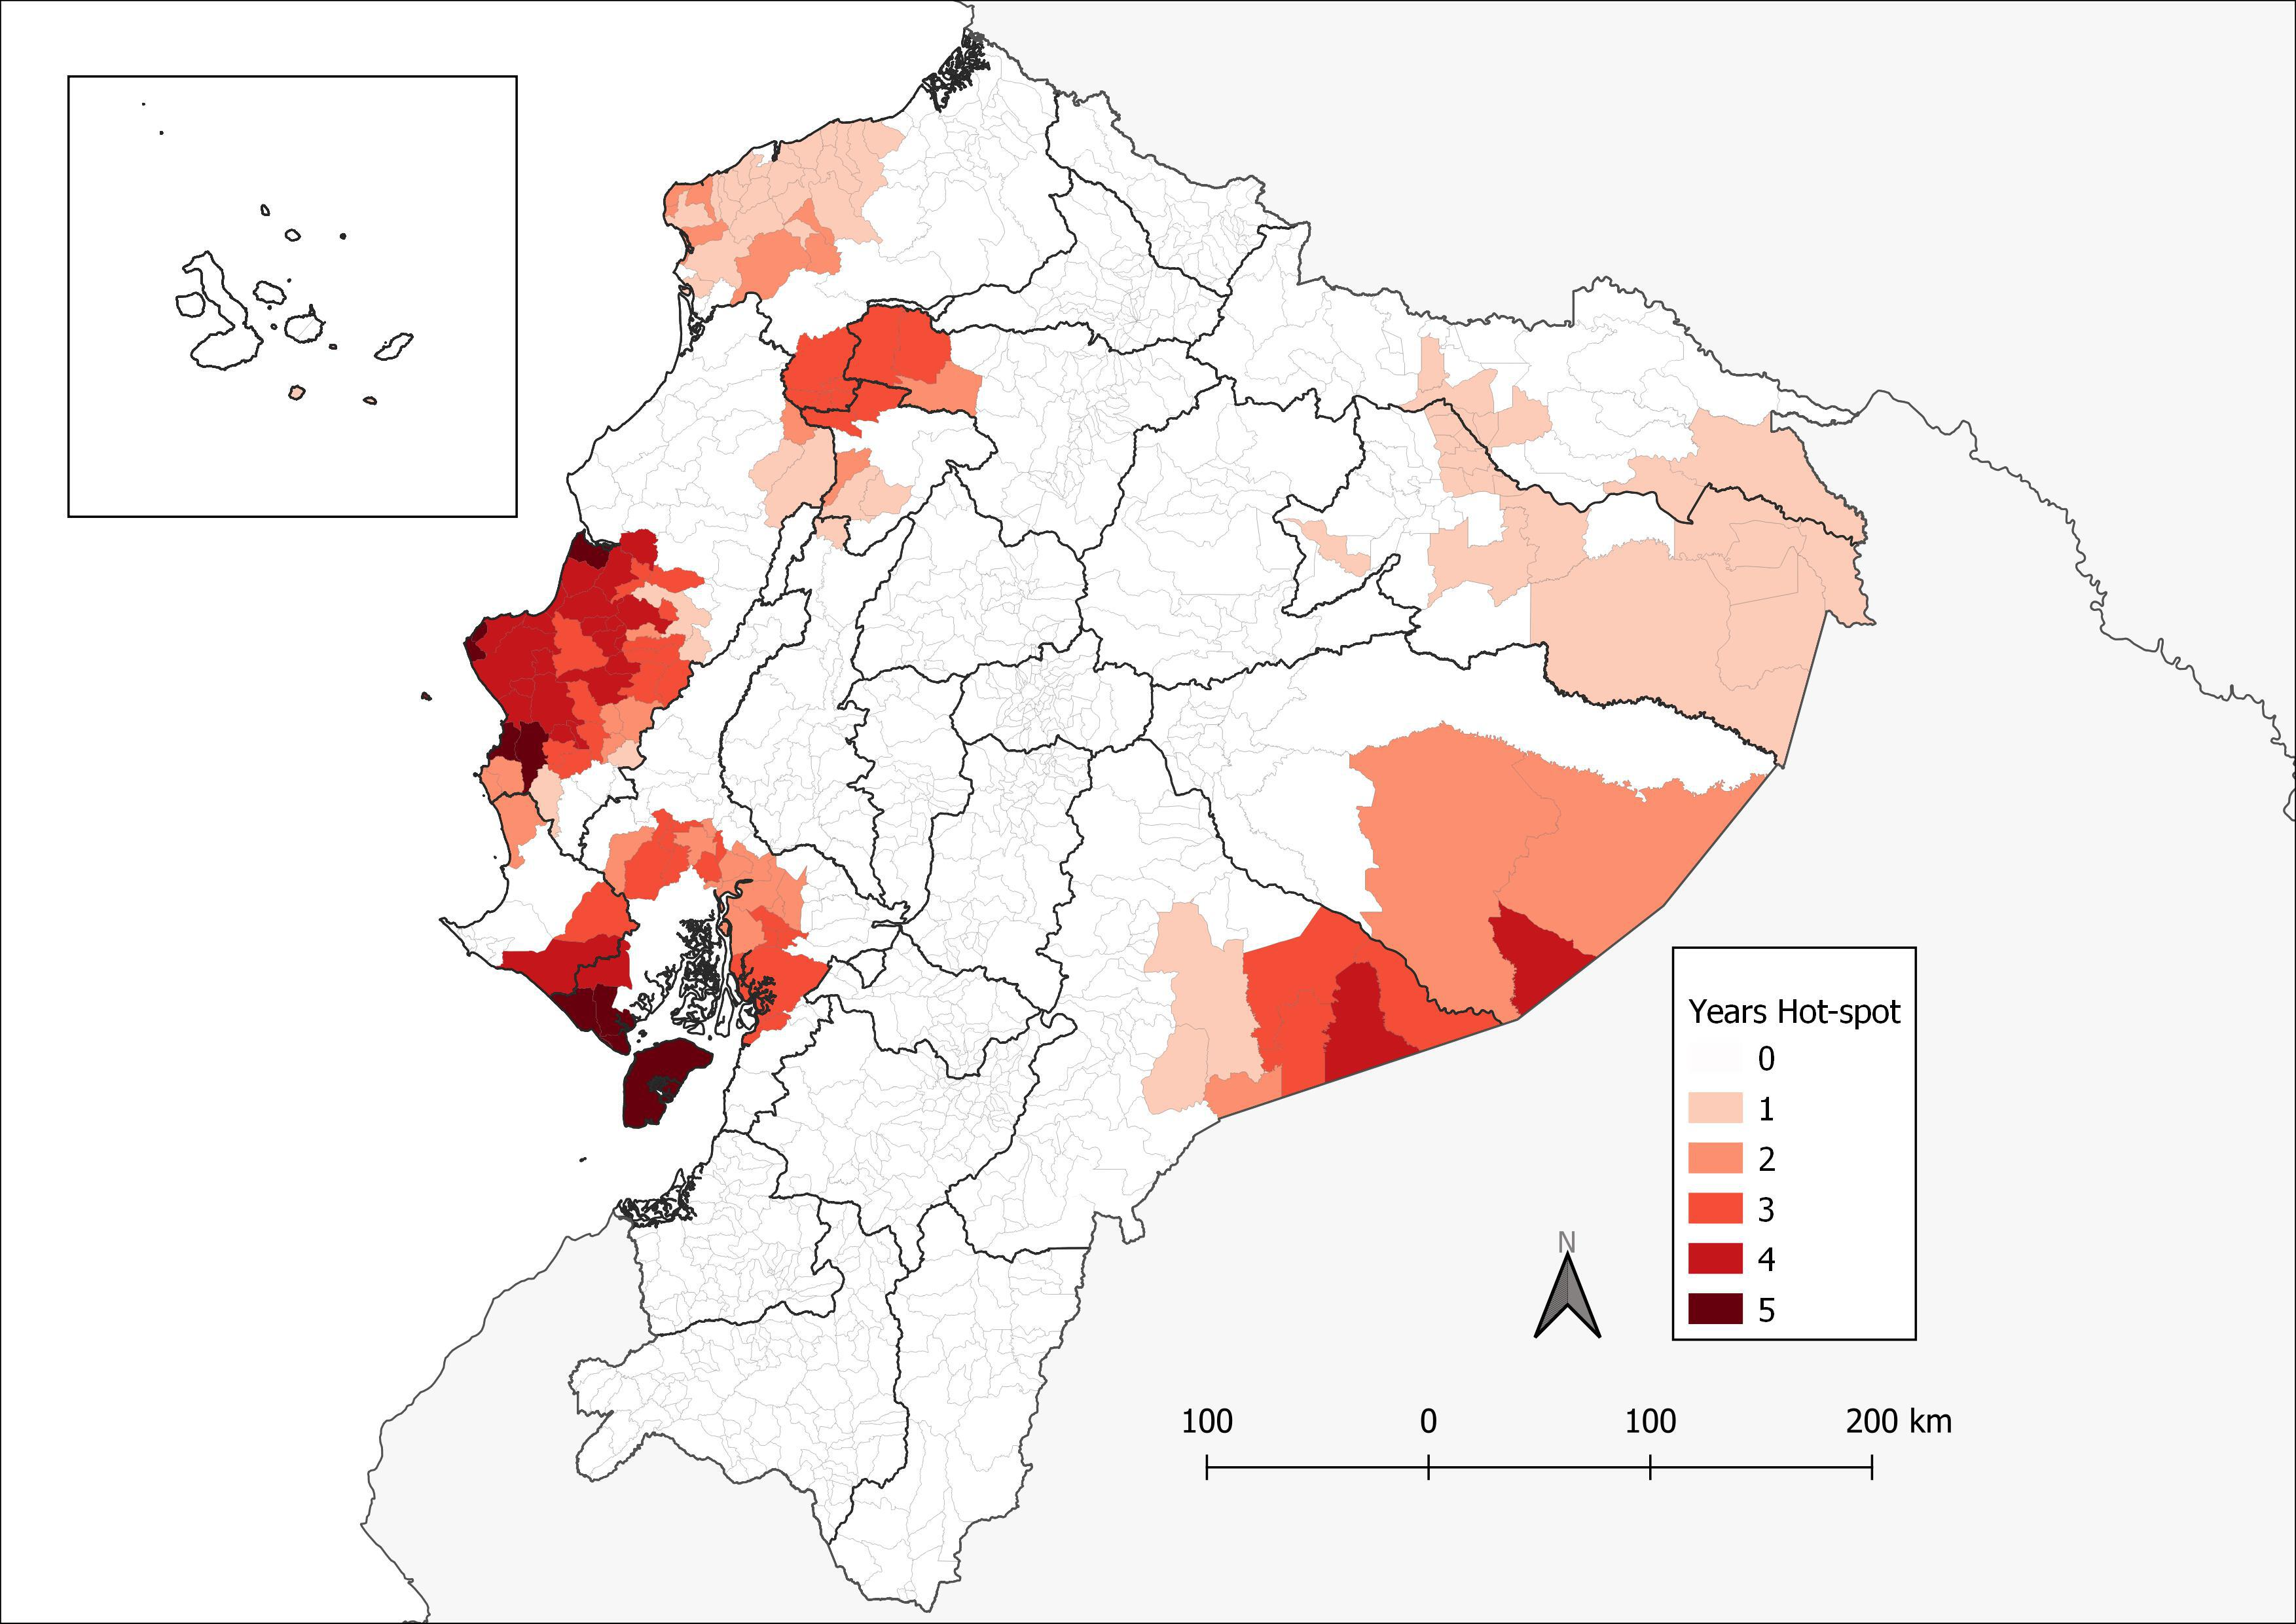
Unit: Degrees.
Epidemiological Surveillance System of the Ministry of Public Health. The added legend is the provincial name.
Source: Prepared by the authors.
Discussion
The results of this study showed that the provinces of Manabí, Guayas, Esmeraldas and El Oro had the highest levels of receptivity and vulnerability to arbovirosis transmission. These findings were mainly associated with environmental factors such as temperature and altitude, as well as limited access to drinking water. At the territorial level, 57 cantons were identified as areas of high transmission, with nine parishes standing out as persistent hotspots during the five consecutive years of the analysis. These findings underline the importance of focusing interventions in areas where arboviral transmission is recurrent and persistent [17], allowing for the optimization of resources and vector control.
The results are consistent with previous studies that have demonstrated the influence of environmental factors on the proliferation of Aedes aegypti, the region’s main vector of arboviral diseases [17,18]. The observed association between increased temperature and rainfall and higher cumulative incidence is consistent with patterns described in other tropical contexts, where climate change has exacerbated the expansion of vectors and the risk of outbreaks [18,19]. In addition, the protective effect of altitude identified in this study coincides with research carried out in other Latin American countries, which has documented a significant decrease in vector density and arboviral transmission at higher altitudes [20,21].
In contrast to previous studies that associate higher population density with greater transmission of arboviral diseases, our results showed that reduced population density was related to increased cumulative incidence [22]. This difference could be explained by the specific conditions in Ecuador, where areas with high population density tend to have better coverage of essential services, such as access to potable water through the public network. This last aspect reduces the need for domestic water storage, a determining factor for Aedes aegypti mosquito reproduction. This aligns with studies in other contexts, such as Vietnam, which reported a higher risk of dengue in rural areas with limited access to clean water [23]. Furthermore, previous research has shown that better water infrastructure reduces the incidence of arbovirosis, which supports our findings [24,25].
Identifying persistent hotspots at the cantonal and parish level underlines the usefulness of spatial analysis for identifying critical transmission zones and targeting vector control interventions more efficiently [26,27,28]. These critical areas are characterized by environmental conditions favorable to the proliferation of the mosquito, such as high temperatures and rainfall, as well as limited access to drinking water. Targeting control strategies at these hotspots would allow for a more effective allocation of resources and more focused surveillance in the highest-risk areas, adapting interventions to each area’s environmental and sociodemographic characteristics [29].
A major strength of this study was the use of a detailed spatial analysis, which allowed us to identify critical areas of transmission and provide evidence for future planning of vector control strategies. However, as an ecological study, it has considerable limitations, such as the impossibility of establishing direct causal relationships between the variables analyzed and the transmission of arbovirosis. In addition, the quality of the secondary data used, which we can´t determine its precision, may influence some results. The annual variability in the classification of hot spots also reflects the sensitivity of the analysis to the specific data of each year, which reinforces the need for continuous validation of these findings.
For future research, we recommend integrating entomological data better to understand vector behavior in relation to environmental factors. Additionally, predictive models that account for the impact of climate change on the spatial distribution of Aedes aegypti should be used to inform long-term control strategies. Combining these approaches would enable the development of more effective, locally tailored interventions, maximizing the impact of public health policies.
Conclusions
Critical areas of arbovirus transmission were identified in Ecuador, showing that the provinces of Manabí, Guayas, Esmeraldas, and El Oro have the highest levels of receptivity and vulnerability. In addition, factors such as temperature, altitude, rainfall, and access to drinking water could be key in the dynamics of Aedes aegypti transmission.
These results emphasize the need for a comprehensive approach combining infrastructure improvement, especially regarding access to essential services, with vector control strategies based on precisely identifying hotspots.
Finally, we recommend prioritizing interventions in high-risk areas, optimizing resource allocation, and improving the response capacity to future outbreaks.
