Estudios originales
← vista completaPublicado el 3 de agosto de 2026 | http://doi.org/10.5867/medwave.2026.07.3195
Exactitud diagnóstica del cuestionario FINDRISC para detección de diabetes mellitus tipo 2 en población de la Sierra Nororiental del Estado de Puebla, México
Diagnostic accuracy of the FINDRISC questionnaire for detecting type 2 diabetes mellitus in an indigenous population from Northeastern Sierra of Puebla, Mexico
Abstract
Introduction The Finnish Diabetes Risk Score questionnaire is a widely used tool for screening type 2 diabetes mellitus; however, its application in Indigenous populations has been little studied. This study assessed the diagnostic accuracy of this questionnaire for detecting cases consistent with type 2 diabetes mellitus in the Totonac population of the state of Puebla, Mexico, and its performance when stratified by gender.
Methods A cross-sectional diagnostic accuracy study with prospective data collection was conducted in 148 adults (≥18 years) without a previous diagnosis of type 2 diabetes mellitus. Participants were residents of communities in the Sierra Nororiental of Puebla and were recruited through convenience sampling with consecutive enrollment during a health fair. The Finnish Diabetes Risk Score questionnaire was used as the index test, evaluated using two cutoff points (≥12 and ≥15); glycated hemoglobin (≥6.5%) was used as the reference standard. Both tests were administered independently and with assessor blinding. Sensitivity, specificity, predictive values, diagnostic accuracy, and the area under the curve were estimated through overall and gender-stratified analyses.
Results At the ≥12 cut-off point, the Finnish Diabetes Risk Score showed an overall sensitivity of 76.4% (95%; CI: 66.6 to 84.0), specificity of 55.9% (95%; CI: 43.3 to 67.9), diagnostic accuracy of 68.2% (95%; CI: 60.4 to 75.2), and an area under the curve of 0.64 (95%; CI: 0.54 to 0.73). In women, sensitivity reached 85.2% (95%; CI: 73.4 to 92.3) and the area under the curve was 0.71 (95%; CI: 0.60 to 0.81), whereas in men the discriminative capacity was limited.
Conclusions The Finnish Diabetes Risk Score questionnaire demonstrated moderate discriminative capacity for detecting cases compatible with type 2 diabetes mellitus in the Totonac Indigenous population, with acceptable performance in women using the cut-off point of ≥12. These findings support its use as an initial screening tool in settings with limited access to confirmatory tests and highlight the need for validation in specific contexts.
Main messages
- Type 2 diabetes mellitus poses a significant burden on indigenous populations, where access to timely diagnosis is limited and there are few validated screening tools available.
- This study evaluated the diagnostic accuracy of the Finnish Diabetes Risk Score questionnaire in a Totonac indigenous population, using glycated hemoglobin as the gold standard, providing the first evidence on its performance in this community.
- Some limitations of this study include potential selection bias due to the voluntary nature of participant enrollment; diagnostic estimates whose accuracy may be compromised in analyses stratified by gender, given that no formal sample size calculation was performed before the study; and a limited evaluation of the instrument’s performance in specific subgroups due to the absence of complementary variables.
Introduction
Type 2 diabetes mellitus is a chronic disease considered a global public health emergency due to the sustained increase in its prevalence, especially in developing countries [1]. According to the International Diabetes Federation (2025), the global prevalence is 11%, corresponding to 589 million people aged 20 to 79; of these, at least four out of ten remain undiagnosed [2]. In Mexico, the prevalence of type 2 diabetes mellitus and prediabetes is 18.3%, and that of prediabetes is 22.1%. In rural areas, these prevalence rates are 15.2% and 22.8%, respectively [3,4].
The magnitude of the burden that diabetes places on health care services and the economic cost it entails for institutions, governments, and families has led to the implementation of specific strategies [5]. In Mexico, the Official Mexican Standard NOM-015-SSA2-2010 for the prevention, treatment, and control of diabetes mellitus remains the current regulatory benchmark [6]. This standard emphasizes the timely detection of the disease and its complications, as well as the implementation of preventive measures among vulnerable groups.
In addition, the current diagnostic criteria for type 2 diabetes mellitus include an oral glucose tolerance test and glycated hemoglobin of 6.5% or higher [7]. However, many public institutions still face limitations related to the availability of supplies, infrastructure, and trained personnel to perform these tests [8,9]. This limitation is even more pronounced in indigenous communities, where additional structural barriers exist, such as limited access to healthcare services, reduced availability of educational resources, and economic constraints [10].
In this context, it is necessary to have accessible, low-cost, and easy-to-implement screening tools that enable the timely identification of cases consistent with diabetes in vulnerable populations [5,11]. Among indigenous populations, two instruments have been primarily used for this purpose: the American Diabetes Association´s Diabetes Risk Calculator and the Finnish Diabetes Risk Score (FINDRISC) questionnaire [12,13,14]. This questionnaire has been widely used internationally [15,16] and has been validated in urban areas of Mexico [13,17]. Although it was originally developed to estimate the future risk of type 2 diabetes mellitus, it has been used as a screening tool to identify undiagnosed cases [16,18]. However, evidence regarding its diagnostic performance in the Mexican indigenous population—particularly in comparison with biochemical tests such as glycated hemoglobin—is limited [12,19,20].
A recent systematic review and meta-analysis reported that the sensitivity and specificity of the Finnish Diabetes Risk Score vary substantially depending on the cutoff point and the population context [18]. This supports the need to evaluate its performance in specific epidemiological and sociocultural contexts [15,18,20]. In this regard, the main objective of the present study was to evaluate the diagnostic accuracy of the Finnish Diabetes Risk Score questionnaire, at cutoff points of 12 or higher and 15 or higher, for the detection of type 2 diabetes mellitus in the Totonac population of the state of Puebla, using glycated hemoglobin as the reference standard, and to assess its performance through a gender-stratified analysis.
Methods
Design
A cross-sectional diagnostic accuracy study with prospective data collection was conducted, in which the Finnish Diabetes Risk Score questionnaire was used as the index test and glycated hemoglobin as the reference standard. Both tests were administered during the same community outreach event using independent and consecutive procedures, while maintaining blinding between the evaluation teams. The study design, conduct, and reporting were carried out in accordance with the Standards for Reporting of Diagnostic Accuracy (STARD) guidelines [21].
Study sample
The sample consisted of 148 adults aged 18 years or older, both men and women, from the communities of Ixtepec and Huehuetla, Puebla, Mexico. Participants were recruited through convenience sampling with consecutive inclusion during a community health fair organized by the Intercultural University of the State of Puebla. The inclusion criteria were: being 18 years of age or older, agreeing to participate by signing an informed consent form, and having no prior diagnosis of type 2 diabetes mellitus. Participants who did not complete both diagnostic tests were excluded.
Furthermore, due to the operational characteristics of the community health event and the nature of the indigenous population studied, no formal sample size calculation was performed before the study. Therefore, all eligible participants during the data collection period were included.
Diagnostic tools and tests
The Spanish version [22] of the Finnish Diabetes Risk Score questionnaire, based on the original instrument [23], was used as the index test. This test includes eight components: age, body-mass index, waist circumference, physical activity level, fruit and vegetable intake, use of antihypertensive medications, history of hyperglycemia, and family history of type 2 diabetes mellitus. Each component contributes a specific score that generates the instrument’s total score. For this study, cutoff points of 12 or higher and 15 or higher were used; these were defined a priori based on previous reports evaluating the performance of the Finnish Diabetes Risk Score [15,18,20].
A cutoff point of 12 or higher has shown greater sensitivity in population-based screening studies and in Latin American contexts, while a cutoff point of 15 or higher corresponds to the traditional cutoff used for this instrument.
Glycated hemoglobin was used as the reference standard because it reflects the average blood glucose level over the past two to three months without requiring prior fasting and exhibits lower intra-individual biological variability [24,25]. It was measured using a capillary blood sample with the Eclipse A1c™ portable system (Kabla Comercial S.A. de C.V., Mexico). The device was calibrated daily according to the manufacturer’s operating instructions before measurements began, and the tests were performed by previously trained personnel. A glycated hemoglobin value of 6.5% or higher was considered indicative of type 2 diabetes mellitus [7,26].
Operating procedure and blinding
The Finnish Diabetes Risk Score questionnaire and the glycated hemoglobin test were administered on the same day through separate workstations, with intervals of less than 30 minutes between each test. Initially, all participants who met the eligibility criteria were assigned a unique, sequential identification code. In addition, they were enrolled consecutively as they arrived at the health fair.
A first team administered the Finnish Diabetes Risk Score questionnaire through a face-to-face interview in Spanish. For participants with limited proficiency in Spanish, bilingual staff facilitated understanding of the items by providing verbal explanations in their native language (Tutunakú), without altering the original structure or content of the instrument. Responses were recorded in Spanish for analysis.
Subsequently, participants were directed to a second station, where glycated hemoglobin samples were collected and processed using the same coding system. The evaluators did not have access to the results obtained during the fieldwork, ensuring blinding between the evaluation teams. No adverse effects resulting from the administration of the tests were reported.
Data processing and analysis
Statistical analyses were performed using SPSS v.25 (IBM Corp., Armonk, NY, USA). Categorical variables were described using frequencies and percentages, and quantitative variables as mean ± standard deviation.
Scores obtained from the Finnish Diabetes Risk Score questionnaire at both cutoff points were classified as positive or negative according to each threshold. Subsequently, 2×2 contingency tables were constructed between the results of the index test and the reference standard. Based on these, sensitivity, specificity, positive predictive value (PPV), and negative predictive value (NPV) were calculated. Likewise, diagnostic accuracy, defined as the total proportion of correct classifications relative to the reference standard, was calculated using the formula (TP + TN) / Total N, where TP corresponds to true positives and TN to true negatives. The 95% confidence intervals were estimated using Wilson’s method for binomial proportions [27].
The overall discriminatory ability of the instrument used was evaluated using receiver operating characteristic curves, comparing its continuous score against glycated hemoglobin (6.5% or higher versus less than 6.5%); the area under the curve, estimated using nonparametric methods, served as the measure of overall discrimination.
To characterize the distribution of the disease, participants with glycated hemoglobin of 6.5% or higher were classified according to the severity of their hyperglycemia (6.5 to 6.9%; 7.0 to 7.9%; 8.0 to 8.9%; 9.0% or higher). Meanwhile, participants with glycated hemoglobin below 6.5% were characterized based on relevant metabolic conditions, including nutritional status and the presence of abdominal adiposity. Nutritional status was classified using body-mass index into normal weight (18.5 to 24.9 kilograms per square meter), overweight (25.0 to 29.9 kilograms per square meter), and obese (30.0 kilograms per square meter or higher). Abdominal adiposity was determined by waist circumference and was considered present when it was 80 centimeters or greater in women and 90 centimeters or greater in men [28].
Finally, given that various authors have documented differences in the distribution of risk factors and health behaviors between men and women [18,20,29], a gender-stratified analysis of these same parameters was conducted. No additional stratified analyses were performed, as they were not part of the study’s objectives and the available sample size did not allow for estimates with sufficient precision in other subgroups. No missing data were identified in the analyzed variables.
Results
During the recruitment period, 245 potentially eligible participants were identified. Of these, 97 were excluded (34 because of having a diagnosis of type 2 diabetes mellitus and 63 because they had not completed both diagnostic tests; Figure 1).
Flowchart of participant selection, administration of the index test (FINDRISC), and the reference standard (glycated hemoglobin).
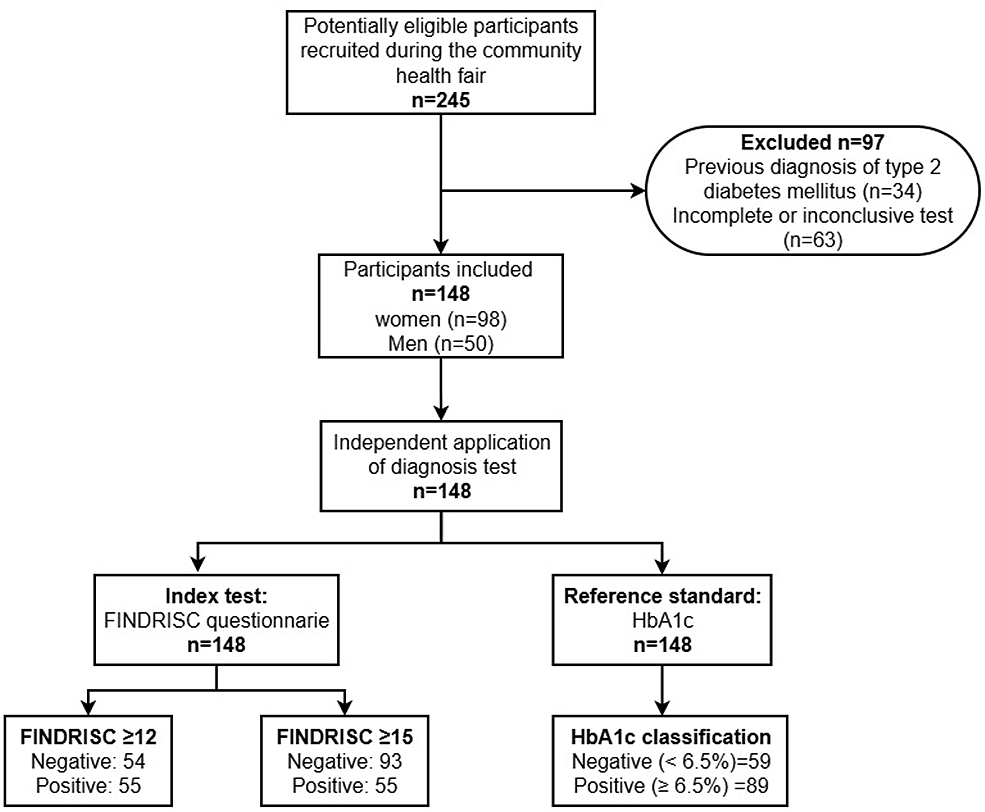
Source: Prepared by the authors based on the study results in accordance with the STARD guidelines [21].
The study sample consisted of 148 adults, predominantly women (66.2%; 98/148) and speakers of Tutunakú (81.7%; 121/148). The average age was 54.3 ± 16.7 years, with a significant difference of 10.6 years between men and women (95% confidence interval: 5.1 to 16.1). Regarding educational attainment, 38.5% (57/148) had completed primary school, while 35.1% (52/148) had no formal education, with a higher percentage among women (38.8%; 38/98). Furthermore, participants had a body-mass index of 26.4 (standard deviation ± 3.9) kilograms per square meter and an average waist circumference of 92.6 centimeters (standard deviation ± 8.5) (Table 1).
After describing the sociodemographic characteristics, the participants were classified according to the categories of the index test and the reference standard. In the Finnish Diabetes Risk Score classification, 44.9% (44/98) of the women and 22.0% (11/50) of the men were classified as high risk, while 33.7% (33/98) of the women and 42.0% (21/50) of the men were classified as low risk. Regarding glycated hemoglobin levels, only 5.4% (8/148) had values consistent with normoglycemia, and 34.5% (51/148) had levels consistent with prediabetes, with the latter being higher among women. In contrast, 55.1% (54/98) of women and 70.0% (35/50) of men had values consistent with type 2 diabetes mellitus (Table 2).
Severity of the condition and relevant metabolic conditions
Subsequently, participants with glycated hemoglobin levels consistent with type 2 diabetes mellitus (60.1%; 89/148) were classified according to glycemic severity. In the total sample, 41.6% (37/89) had glycated hemoglobin values between 7.0% and 7.9%, while 24.7% (22/89) had levels of 8.0% or higher. When analyzing the distribution by gender, a higher proportion of men was observed in the 7.0 to 7.9% category (48.6%; 17/35) compared with women (37.0%; 20/54). In contrast, women had a slightly higher proportion of values equal to or greater than 8.0% (27.8%; 15/54) compared to men (20.0%; 7/35) (Table 3).
In addition, the metabolic conditions present in participants without type 2 diabetes mellitus (glycated hemoglobin < 6.5%) were described. The results showed that prediabetes was the predominant metabolic condition (86.4%; 51/59), of whom 45.1% (23/51) were of normal weight and 43.1% (22/51) were overweight. Among participants with normal blood glucose levels, 50% (4/8) were overweight. Furthermore, when abdominal adiposity was assessed, 81.4% (48/59) of the participants exhibited it, with a higher prevalence among those with prediabetes (82.3%; 42/51) (Table 3).
Sensitivity and specificity of the Finnish Diabetes Risk Score est
Using the cut-off points of the Finnish Diabetes Risk Score questionnaire as a reference, 2×2 contingency tables were constructed against the reference standard (glycated hemoglobin ≥ 6.5%), both for the total sample and for the sample stratified by gender. The results showed that, in the total sample, more than 70% of cases with a positive score also had an HbA1c level of 6.5% or higher (true positives), regardless of the cutoff value used. At a cutoff value of 12 or higher, 61.1% (33/54) of participants with a negative questionnaire score also had an HbA1c level below 6.5% (true negatives); this proportion decreased to 46.2% (43/93) at a cutoff of 15 or higher (Table 4).
When stratified by gender, women showed a higher proportion of true positives, particularly at the cutoff of 15 or higher (72.7%; 32/44). Likewise, the cutoff of 12 or higher showed a higher proportion of true negatives (75.8%; 25/33). In contrast, men showed a higher frequency of false negatives, especially at a cutoff of 15 or higher (71.8%; 28/39, Table 4).
Subsequently, when evaluating the diagnostic performance parameters, the results showed that, in the total sample, a cutoff point of 12 or higher achieved a sensitivity of 76.4% (95% confidence interval: 66.6 to 84.0) and a specificity of 55.9% (95% confidence interval: 43.3 to 67.9). In contrast, for a cutoff point of 15 or higher, lower sensitivity was observed (43.8%; 95% confidence interval: 34.0 to 54.1). Diagnostic accuracy was better at a cutoff point of 12 or higher (68.2%; confidence interval: 95%; 60.4 to 75.2; Table 5).
When stratified by gender, women showed higher sensitivity at both cut-off points, particularly at the cut-off of 12 or higher (85.2%; 95% confidence interval: 73.4 to 92.3) compared with men. In contrast, men showed lower sensitivity, especially for the cutoff of 15 or higher (20.0%; 95% confidence interval: 10.0 to 35.9), achieving a specificity of 73.3% (95% confidence interval: 48.1 to 89.1). The highest percentage of diagnostic accuracy was obtained in samples from women at a cutoff point of 12 or higher (72.5%; 95% confidence interval: 63.0 to 80.3) (Table 5).
Analysis using receiver operating characteristic curves showed that the Finnish Diabetes Risk Score questionnaire had moderate discriminatory power in the total sample, with an area under the curve of 0.64 (95% confidence interval: 0.54 to 0.73). When the analysis was stratified by gender, an area under the curve of 0.71 (95% confidence interval: 0.60 to 0.81) was obtained for women and 0.51 (95% confidence interval: 0.31 to 0.69) for men (Figure 2).
ROC curves of the FINDRISC questionnaire for identifying elevated HbA1c (≥ 6.5%).
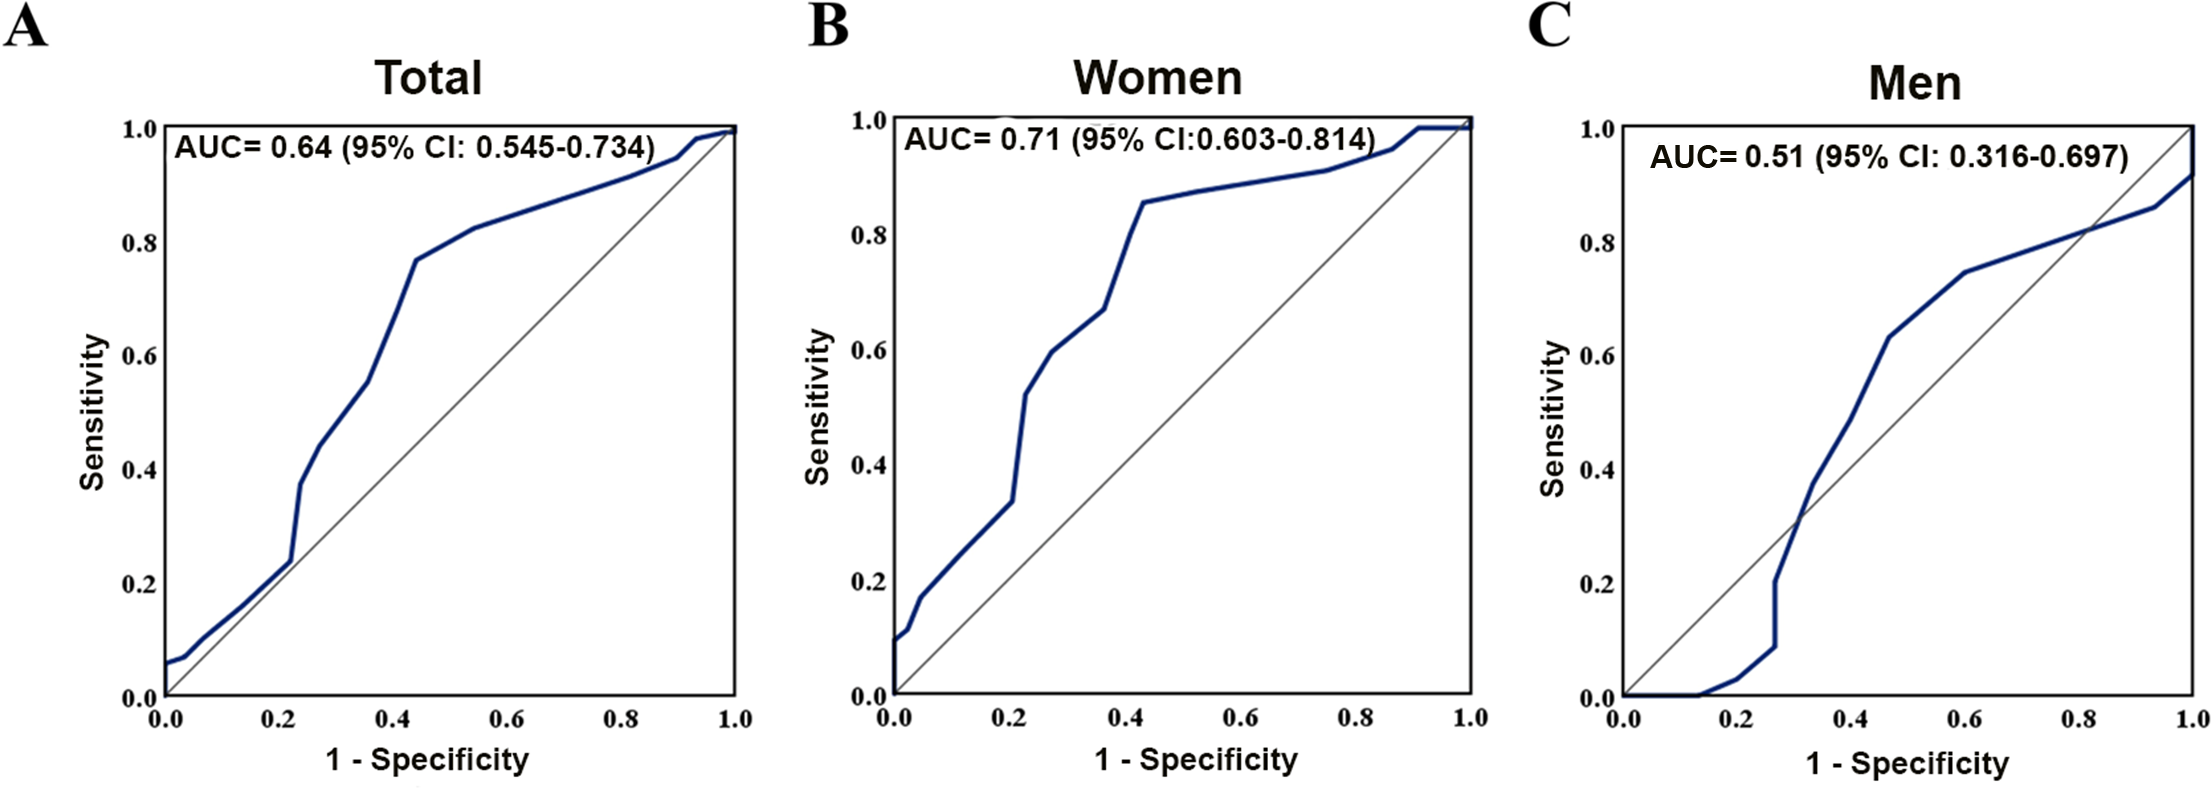
AUC: area under the curve; CI: confidence interval; ROC: receiver operating characteristic curve; FINDRISC: Finnish Diabetes Risk Score; HbA1c: glycated hemoglobin.
Source: Prepared by the authors based on the study results.
Discussion
Diabetes mellitus is one of the leading public health challenges of the twenty-first century [4,30]. Its burden is disproportionately higher among Indigenous populations, where structural inequalities and barriers to healthcare access substantially contribute to diabetes-related complications and premature mortality [8,9,10,30,31]. Although several screening tools are available, including the Finnish Diabetes Risk Score (FINDRISC), which has been extensively evaluated in different populations worldwide [18,20,32], its performance in Indigenous populations has been insufficiently investigated. Therefore, the present study provides the first evidence regarding its diagnostic performance in a Totonac community.
Our findings showed that the diagnostic performance of the FINDRISC questionnaire improved when a cutoff value of ≥12 was applied, achieving moderate discriminatory ability and a sensitivity of 76.4% (95% confidence interval: 66.6 to 84.0). These findings are consistent with previous studies demonstrating that demographic, clinical, and epidemiological characteristics of the target population influence the performance of the instrument [16,33,34,35]. Accordingly, adapting the cutoff value may reduce the number of individuals requiring confirmatory testing while improving the identification of previously undiagnosed cases of type 2 diabetes mellitus [15,16,17,18].
Similarly, the gender-stratified analysis revealed that the performance of the instrument was not uniform across subgroups. Among women, the ≥12 cutoff yielded the highest sensitivity, even exceeding that reported for other screening tools developed for non-Indigenous Mexican women [36,37]. In contrast, the instrument demonstrated limited performance among men.
These differences may be explained by both biological and sociocultural factors. From a biological perspective, gender-related differences in body composition and adiposity may influence the ability of the anthropometric components of the questionnaire to accurately reflect the underlying metabolic condition. In women, the predominance of peripheral fat distribution may enhance the relationship between adiposity and body-mass index [38,39]. While in men, this relationship may be less consistent because of greater lean body-mass and a higher accumulation of central and visceral adiposity [38,39,40,41].
Furthermore, the high prevalence of overweight, obesity, and abdominal adiposity observed among participants without type 2 diabetes mellitus may also have affected the specificity of the instrument. This finding is consistent with the spectrum effect described for screening and risk prediction tests, whereby a high prevalence of anthropometric risk factors reduces the ability of the instrument to discriminate between individuals with and without diabetes, thereby increasing the number of false-positive results [42].
In addition, previous studies have shown that gender norms and stereotypes influence not only how individuals report their medical history and risk factors [29,33,43], but also their perception of disease risk, self-care practices, and healthcare-seeking behaviors [12,33,34]. Consequently, some of the variables included in the FINDRISC questionnaire may not adequately capture the biological and sociocultural determinants of diabetes risk in this population, thereby limiting its diagnostic performance.
Although the FINDRISC questionnaire showed limited performance among men, its diagnostic performance in women represents a particularly relevant finding. This result is especially important considering that women with type 2 diabetes mellitus experience greater cardiovascular risk and poorer clinical outcomes than men [29]. Moreover, among Mexican Indigenous populations, women bear a higher burden of diabetes-related risk factors, a situation further exacerbated by economic dependence, gender inequalities, and barriers to self-care and timely access to healthcare services [8,31,44].
In this context, the FINDRISC questionnaire, using a cutoff value of ≥12, may represent a useful initial screening tool for Indigenous women. Nevertheless, its implementation should be supported by local validation and contextual adaptation, given that perceptions of health and disease in Indigenous communities are strongly influenced by cultural beliefs, worldviews, and community practices [11,30,31,45].
Study limitations
Several limitations should be considered when interpreting the findings of this study. First, participants were recruited on a voluntary basis, which may have introduced selection bias, as individuals who chose to participate may have been more concerned about their health status or already aware of potential diabetes risk factors.
Second, no formal sample size calculation was performed before the study because all eligible participants available during the data collection period were included from Indigenous communities with relatively small populations. This may have affected the precision of the diagnostic accuracy estimates, particularly in the gender-stratified analyses, as reflected by the relatively wide confidence intervals. Therefore, these findings should be interpreted with caution and considered preliminary evidence for this population.
In addition, the absence of complementary variables limited the possibility of evaluating the performance of the instrument in specific subgroups, which could have provided a more detailed characterization of diabetes risk.
Regarding the linguistic component, the FINDRISC questionnaire did not undergo a formal translation and cross-cultural validation process into the Tutunakú language. Although linguistic mediation was provided by bilingual personnel native to the region, facilitating participants' understanding of the questionnaire items, the possibility of differences in interpretation cannot be completely excluded and therefore represents a methodological limitation. Moreover, because some questionnaire items rely on participants' prior knowledge of their health status, limited access to healthcare services may have reduced this knowledge, potentially affecting the accuracy of some responses regardless of the language used.
Conclusions
The Finnish Diabetes Risk Score demonstrated moderate diagnostic performance in the Totonac Indigenous population, with better performance among women when a cutoff value of ≥12 was used, characterized by high sensitivity but low specificity. These findings suggest that the instrument may be useful as an initial screening tool in this population, particularly in settings where access to biochemical diagnostic testing is limited, provided that positive results are confirmed with diagnostic testing.
In contrast, its limited performance among men highlights the need to develop or adapt more sensitive screening tools for this subgroup. Overall, these findings underscore the importance of considering both gender-related differences and the sociocultural context when evaluating and implementing diabetes screening instruments in Indigenous populations.