Estudios originales
← vista completaPublicado el 13 de marzo de 2026 | http://doi.org/10.5867/medwave.2026.02.3205
Validación de la adaptación cultural de los “Long Coronavirus Disease (COVID) Symptom and Impact Tools” para población chilena
Validation of the cultural adaptation of the "Long Coronavirus Disease (COVID) Symptom and Impact Tools" for the Chilean population
Abstract
Introduction The Long Coronavirus Disease (COVID) Symptom and Impact Tools (ST and IT) are self-administered instruments designed to monitor symptoms and the impact of long COVID. We translated and culturally adapted these tools for use in Chile. This study evaluated internal consistency and test–retest reliability for the IT, described reported symptoms with the ST, and explored changes over time.
Methods The first phase, previously published, involved translation and cultural adaptation. The second phase included 28 patients with persistent COVID-19 symptoms; 20 completed a second assessment. The IT assesses impact using six items, each scored 0–10 (total 0–60). The ST lists 53 symptoms across ten categories. Internal consistency of the IT was assessed using Cronbach’s alpha and item-consistency indicators. Test–retest reliability was evaluated using the intraclass correlation coefficient (ICC, 95% CI) and a Bland–Altman analysis. ST responses were summarized with absolute and relative frequencies and confidence intervals.
Results The IT showed excellent internal consistency (Cronbach’s alpha 0.945; 95% CI 0.906–0.971). Test–retest reliability was acceptable (ICC 0.72; 95% CI 0.43–0.88), with minimal bias in the Bland–Altman plot. General, neurological, thoracic, and ear–nose–throat symptoms were the most frequent. Participants reported a mean of 19 symptoms, with no significant differences between visits.
Conclusions The adapted tools demonstrated acceptable psychometric properties and appear suitable for use in Chile. Symptom reporting was extensive, underscoring the need for larger studies to confirm these findings.
Main messages
- Long COVID remains a significant challenge, and culturally adapted tools to assess its impact are lacking. This study provides the first Chilean adaptation of the Symptom and Impact Tools.
- The adapted Impact Tool showed excellent internal consistency and acceptable test–retest reliability, indicating coherent and stable measurement.
- Participants reported a high symptom burden, with general and neurological symptoms most frequent, highlighting the need for context-specific assessment.
- The main limitation was the small sample size, which prevented confirmatory factor analysis and may have influenced reliability estimates.
- Despite these limitations, the adapted tools appear suitable for use in Chile and offer a foundation for future validation in larger cohorts.
Introduction
On January 30, 2020, the World Health Organization (WHO) declared the COVID-19 epidemic a public health emergency of international concern [1]. Concerns began a month earlier, when a new member of the coronavirus family (SARS-CoV-2) was identified as the cause of a cluster of pneumonia cases in Wuhan (Hubei province, China). On March 11, 2020, the WHO officially declared a pandemic. Cases and deaths rose steadily from 2020 to 2021 and began to decline in 2022. On May 5, 2023, the Director General of the WHO, on behalf of its Emergency Committee, declared the end of the public health emergency of international concern [2]. During this period, over 700 million cases and seven million deaths were reported. The pandemic ended, but COVID-19 did not. Between August 24 and August 31, 2025, 27,000 cases and 1,249 deaths were reported to the WHO [3].
The epidemic left significant sequelae, as reported in the literature [4,5]. In October 2021, the WHO released a report with a clinical definition of post-COVID-19 syndrome cases [6], followed by a publication [7]. The condition, also known as persistent COVID or Long COVID, is characterized by a series of symptoms that affect almost all systems and persist for at least 3 months after the initial infection with the virus [8].
The need for tools to measure the severity or seriousness of Long Covid symptoms became apparent. In 2020, the COVID-19 Yorkshire Rehab Screen (C19-YRS) scale was published, measuring four subscales: symptom severity, functional disability, additional symptoms, and general health [9]. After this first scale, at least three more appeared: Post–COVID-19 Functional Status (PCFS) [10], post-acute (long) COVID-19 quality of life (PAC-19QoL) instrument [11], and a pair of scales that are applied together called Long Coronavirus Disease (COVID) Symptom and Impact Tools [12].
The need to culturally adapt self-administered scales to measure the different abstract aspects of health, known as "patient-reported health outcomes" (PROM), is evident—given the cultural and idiosyncratic diversity across geographic regions—and is widely recognized [13].
The combination of scales (Long Coronavirus Disease (COVID) Symptom and Impact Tools) was selected by our research group for translation and cultural adaptation for use in the national context. The Long Coronavirus Disease (COVID) Symptom and Impact Tools (ST and IT) are a pair of self-administered instruments developed to monitor the symptoms and impact of long COVID for clinical practice and were devised from patients' experiences. We first conducted the translation and cultural adaptation according to recognized guidelines, primarily those of Guillemin et al. [14] and Beaton et al. [15], and we also included an evaluation of content validity with a group of experts using standard techniques [15,16,17]. The results of this first part were published in 2024 [18].
The second part of the study aimed to evaluate reliability through internal consistency and test-retest in 60 subjects, and to assess the instrument’s structural validity through confirmatory factor analysis in a sample of 300 patients who met the study’s inclusion criteria. However, the introduction of COVID-19 vaccines in Chile, administered to the Chilean population annually from 2020 to date, has led to a significant decrease in cases. While in mid-2020 over 7,000 new cases were reported daily, the number has fallen to 32 in the week of August 3-9, 2025 (official Covid-19 figures from the Government of Chile). Coupled with a cutback in SARS-CoV-2 testing, the decline in cases prevented us from achieving the planned sample size for the second stage of the project. Notwithstanding, COVID-19 remains prevalent worldwide, and persistent COVID-19 remains a concern [19]; thus, the justification for cultural adaptation remains valid.
The purpose of this study is to evaluate the internal consistency and test-retest reliability of the adapted instrument, as well as to describe its symptoms and explore changes over time.
Methods
The first phase of the study involved the translation and cultural adaptation of the two tools, symptom and impact, the results of which have already been published [18].
The second phase, reported in this article, involved administering the tools to 28 patients from the COmmunity Cohort who reported symptoms consistent with persistent COVID-19. This community-based cohort was established in 2022 and 2023 and enrolled 914 adults with cardiovascular risk factors to measure the humoral immune response to SARS-CoV-2 antigen exposure, whether by vaccination or infection, as well as the incidence of COVID-19 and other adverse events [20].
Twenty of them underwent a second assessment between 27 and 83 days after the first. The ST symptom questionnaire was also administered at the first and second appointments.
Description of instruments
The IT measures the impact of long COVID on patients' daily activities. It consists of six questions: daily chores, family life, professional life, social life, mental state, and relationship with caregivers or healthcare providers. Each question is answered on a 10-point scale ranging from 0 (no impact) to 10 (maximum impact, significant limitation of activities). The final score for the instrument is the sum of points ranging from 0 to 60.
The ST is a list of 53 symptoms sorted into ten categories: general (11), neurological (11), thoracic (6), musculoskeletal (4), digestive (3), ear, nose, and throat (5), dermatological (4), eye symptoms (3), blood vessel and lymph node (4), and urogenital (2). The ST score is the number of symptoms selected by patients, ranging from 0 to 53.
Statistical analysis
For the IT questionnaire, with a sample of 28 patients, the response descriptions and the internal consistency assessment were obtained. The description of the responses included minimum and maximum values, the mean, the median (with bootstrap confidence intervals), and the interquartile range. The inclusion of the median and interquartile range is due to the nature of the responses (ranging from 0 to 10) and the small sample size. The internal consistency assessment included Cronbach’s alpha coefficient (with confidence interval) and elements indicating the degree of homogeneity or internal consistency: a) the correlation between all pairs of items; b) for each item on the scale, the following were obtained: mean and variance of the scale and correlation with the total score if the item is removed, coefficient of determination for that item if it is put as a linear function of the rest (i.e. percentage of variation of the item explained by the rest of the items) and Cronbach’s alpha of the scale if the item is removed.
For the 20 patients who responded to the questionnaire twice, the intraclass correlation coefficient was calculated to evaluate test-retest reliability, with a 95% confidence interval. A Bland-Altman plot was added to identify differences and extreme values better. The calculation of the standard error of measurement (SEM), obtained from the standard deviation of the scores and the intraclass correlation coefficient (ICC), was added to this reliability assessment. The SEM allows the magnitude of the expected absolute error in individual measurements to be estimated. Likewise, the minimum detectable change (MDC) was derived at 95% confidence to determine the minimum threshold of variation in the score that can be considered a real change and not attributable to measurement error. These indicators complement the ICC and Bland-Altman analysis, providing a more complete picture of the instrument’s test-retest reliability.
Because floor effects can artificially reduce between-subject variability and bias ICC estimates downward, a sensitivity analysis was conducted. The ICC was recalculated after excluding participants who obtained the minimum possible score in both administrations, allowing us to evaluate the robustness of the test–retest reliability to potential floor effects.
The responses to the ST questionnaire yielded a table of absolute and relative frequencies for each symptom. Confidence intervals were also obtained for the percentages of occurrence of each symptom and of the symptoms grouped into eight groups shown in Table 1. The 95% confidence intervals were calculated using the Wilson method recommended for small samples due to its superior coverage properties compared to other methods [21].
Symptoms were shown as absolute and relative frequencies with confidence intervals for percentages. The mean and median were also calculated for the total number of symptoms and by system, along with their respective confidence intervals. The mean and median were also calculated for the differences between the first and second visits for symptoms overall and by system, along with their respective confidence intervals. In both cases, the confidence intervals were calculated by sampling simulation (bootstrap).
Cronbach’s alpha coefficient and internal consistency indicators, as well as the intraclass correlation coefficient with its confidence interval, were obtained using SPSS V23.0. We also used this statistical software package to analyze symptoms. We obtained the confidence interval for Cronbach’s alpha directly using the formula proposed by Feldt et al. [22].
Results
The final validation of the adapted ST and IT questionnaires was conducted with 28 subjects, of whom one was male (3.6%), and the rest were female. The mean age at the time of the first COVID-19 diagnosis was 55.4 years (SD = 10.3; range: 33–76). At study entry, participants had a mean age of 59.1 years (SD = 10.4; range: 36–81). The average time elapsed between the initial COVID-19 diagnosis, and the start of the study was 3.7 years (SD = 1.0; range: 2–5). Regarding the severity of the acute infection, six participants (21.4%) had severe disease, four (14.3%) moderate disease, and 18 (64.3%) mild disease. All participants reported symptoms that had persisted to some degree since their initial COVID-19 infection.
Twenty subjects completed the questionnaire twice, with an interval of 27-84 days (mean 50.6, median 48 days).
The summary of the responses to the IT questionnaire items is shown in Table 1. It is noteworthy that some patients reported no impact of the disease on their lives, and 50% had a total score of 15 or less. On the original scale, a score of less than 30 was considered an acceptable symptom state by more than 75% of patients.
In terms of reliability, as measured by internal consistency, the IT questionnaire yielded Cronbach’s alpha of 0.945 (95% CI: 0.906 to 0.971). The elements used to assess internal consistency are shown in Table 2, except for the item-by-item correlation matrix. In this matrix, the lowest coefficient was 0.508 between items 1 and 4, and the highest correlation coefficient was 0.85 between items 5 and 6. The remaining internal consistency indicators were within acceptable limits. The lowest multiple correlation squared between an item and the rest of the items was 0.77, indicating that the lowest percentage of an item’s variation explained by the rest is 77%.
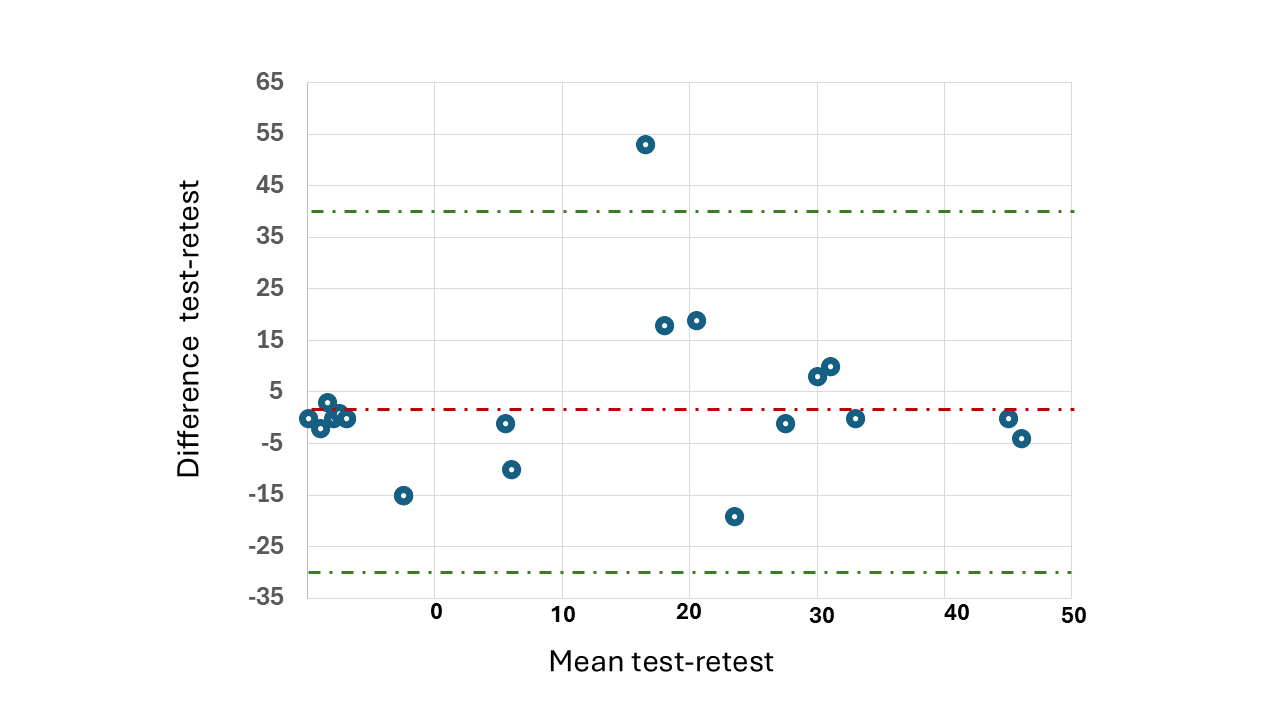
Regarding test-retest reliability evaluated with 20 patients, an intraclass correlation coefficient of 0.72 (95% CI: 0.43 to 0.88) was obtained. The Bland-Altman plot (Figure 1) shows a bias close to zero, indicating good test-retest stability. The limits of agreement are approximately between -30 and +30 units, within which most observations fall. No pattern of proportional bias is detected, and the dispersion appears homogeneous across the range of means. This suggests acceptable agreement between measurements. The standard error of measurement (SEM) was estimated at 10.3 points, equivalent to 17% of the scale’s total range (0–60), indicating considerable variability in individual scores. Based on this value, we calculated the minimum detectable change (MDC) at 95% confidence to be 28.5 points, approximately half the scale’s range. These results suggest that, although the instrument has an average bias close to zero and acceptable agreement, only large changes are reliable, limiting its sensitivity to detect small individual variations in the impact of persistent COVID-19 on patients' quality of life.
Bland-Altman graphic for assessing test-retest reliability.
A sensitivity analysis was conducted to examine whether floor effects influenced the test–retest reliability estimates. One participant who obtained the minimum possible score in both administrations was excluded, and the ICC was recalculated using the remaining 19 cases. The ICC increased from 0.72 (95% CI: 0.43–0.88) in the full sample to 0.82 (95% CI: 0.54–0.93) after excluding this case. Although the point estimate improved, the confidence intervals overlapped substantially, indicating that the potential floor effect did not materially alter the interpretation of the instrument’s test–retest reliability.
Table 3 shows the number of symptoms overall and those affecting the different systems covered by the questionnaire for the 28 patients at their first visit. The most frequent were general, neurological, thoracic, and throat, nose, and ear symptoms, which were present to some extent in 75% of cases. The least frequent symptoms were urogenital symptoms, which did not occur in 61% of cases. Table 4 shows the mean values (mean and median) of the number of symptoms in general and by system. On average, patients had 19 symptoms, and 50% had 20 or more. General and neurological symptoms averaged four per patient.
The 20 patients who responded to the questionnaire twice enabled analysis of symptom changes. Most average symptoms, in general and by system, showed slight differences (Table 5), although the confidence intervals indicate that these differences are not significant. However, the observed mean differences mostly show a decrease in the number of symptoms.
Discussion
Our results indicate excellent internal consistency of the adapted IT instrument and very acceptable test–retest reliability. Symptom assessment showed that, on average, participants reported 20–24 symptoms, with the general and neurological systems being the most frequently affected. No significant differences were observed in the number of overall or system-specific symptoms between the first and second visits.
In a 2024 systematic review, Baalmann et al. critically evaluated the quality of existing instruments for measuring patient-reported outcomes (PROMs) in patients with persistent COVID-19. They identified those that, according to their analysis, could be recommended for future research [23]. They found 11 instruments across 23 publications, the vast majority of which were developed in English or initially translated into English and subsequently cross-culturally adapted into other languages. We did not identify adaptations for different settings for the IT and ST scales. Therefore, for comparison purposes, the discussion will incorporate the cultural adaptations made to other instruments, all of which are designed to assess, in one way or another, the impact of persistent COVID-19 on patients' lives.
Our adapted scale achieved high internal consistency (Cronbach’s alpha = 0.945) with a relatively narrow confidence interval (0.906 to 0.971), indicating that, in the population, the probability of this coefficient being above 0.9 is very high. Streiner, however, points out that an alpha coefficient greater than 0.9 may indicate redundancy [24]. The test-retest reliability of our adapted scale was supported by a moderately adequate intraclass correlation coefficient [25]. The Bland-Altman plot corroborates this statement, although it also indicates that the scale has limitations in detecting small changes in patient scores. The Spanish adaptation of the PAC-19QoL scale to assess quality of life in patients with persistent COVID-19 achieved slightly higher results, showing an ICC of 0.8 for test-retest reliability [26]. The Greek version of the post-COVID-19 Functional Status Scale achieved an ICC of 0.9 (95% CI 0.90 to 0.95) and a Cronbach’s alpha of 0.9 [27], and the Portuguese-Brazilian version of this scale obtained a Cronbach’s alpha of 0.85 [28].
Regarding the presentation of symptoms, our sample is relatively small for a broad discussion. However, we can point out some similarities and differences with recent studies. A recent study conducted in Japan reports that only 2.9% of patients (15/515) had more than 10 symptoms at 6 months after disease onset [29], which contrasts with a median of 20 symptoms observed in our patients. Regarding specific symptoms, our patients had slightly higher percentages (less than 10 percentage points) for fatigue, loss of smell, and diarrhea, and considerably higher percentages (more than 20 percentage points) for insomnia, headache, memory problems, dyspnea, cough, and joint pain. A 2021 study using international data reported an average of 14-16 symptoms per patient at three or six months [30], which we can consider similar to our observed figure of 19. Another study published in 2022 described the prevalence and sociodemographic factors in patients with persistent COVID-19, showing considerably less frequency than ours in symptoms such as insomnia, headaches, and memory problems (27 percentage points less on average), but showed a higher frequency of loss of smell (22 percentage points more) [31]. A 2021 study with an eight- to ten-month follow-up after the first COVID also found lower prevalences than ours for almost all symptoms [32].
Our study has several limitations, the most important being the small sample size. This limitation prevented us from performing confirmatory factor analysis to evaluate the validity of the adapted scale. Although internal consistency does not replace construct validity, both are based on the internal relationships among items; therefore, good internal consistency provides evidence that supports—although it is not sufficient—that the adapted items fit the intended conceptual dimensions. Future studies with larger samples should confirm the factor structure and fully establish the construct validity. An additional limitation of the study was the breadth and variability of the interval between the two assessments (21–83 days). This heterogeneous range may have affected test-retest reliability estimates, as longer intervals increase the likelihood of actual changes in patients' clinical condition. In comparison, shorter intervals may favor recall of responses. Consequently, the values of the intraclass correlation coefficient (ICC), standard error of measurement (SEM), and minimum detectable change (MDC) should be interpreted with caution, as part of the observed variability may reflect clinical changes rather than solely measurement error.
Conclusions
Despite the small sample size, the adapted IT and ST instruments demonstrated acceptable psychometric properties and appear suitable for use in the Chilean context. Symptom reporting in our cohort was notably extensive, suggesting a more florid and abundant symptomatology than that described in other studies abroad. These findings should be corroborated in future research with larger and more diverse samples.
