
Published on 23 de septiembre de 2026 | http://doi.org/10.5867/medwave.2026.08.3234
Post-COVID symptoms prevalence, latent class pattern, and functional impact: A population-based cross-sectional study in two Chilean cities, 2024
Latent class analysis of post-COVID-19 symptoms: Probability of symptoms by class, Chile, 2024.
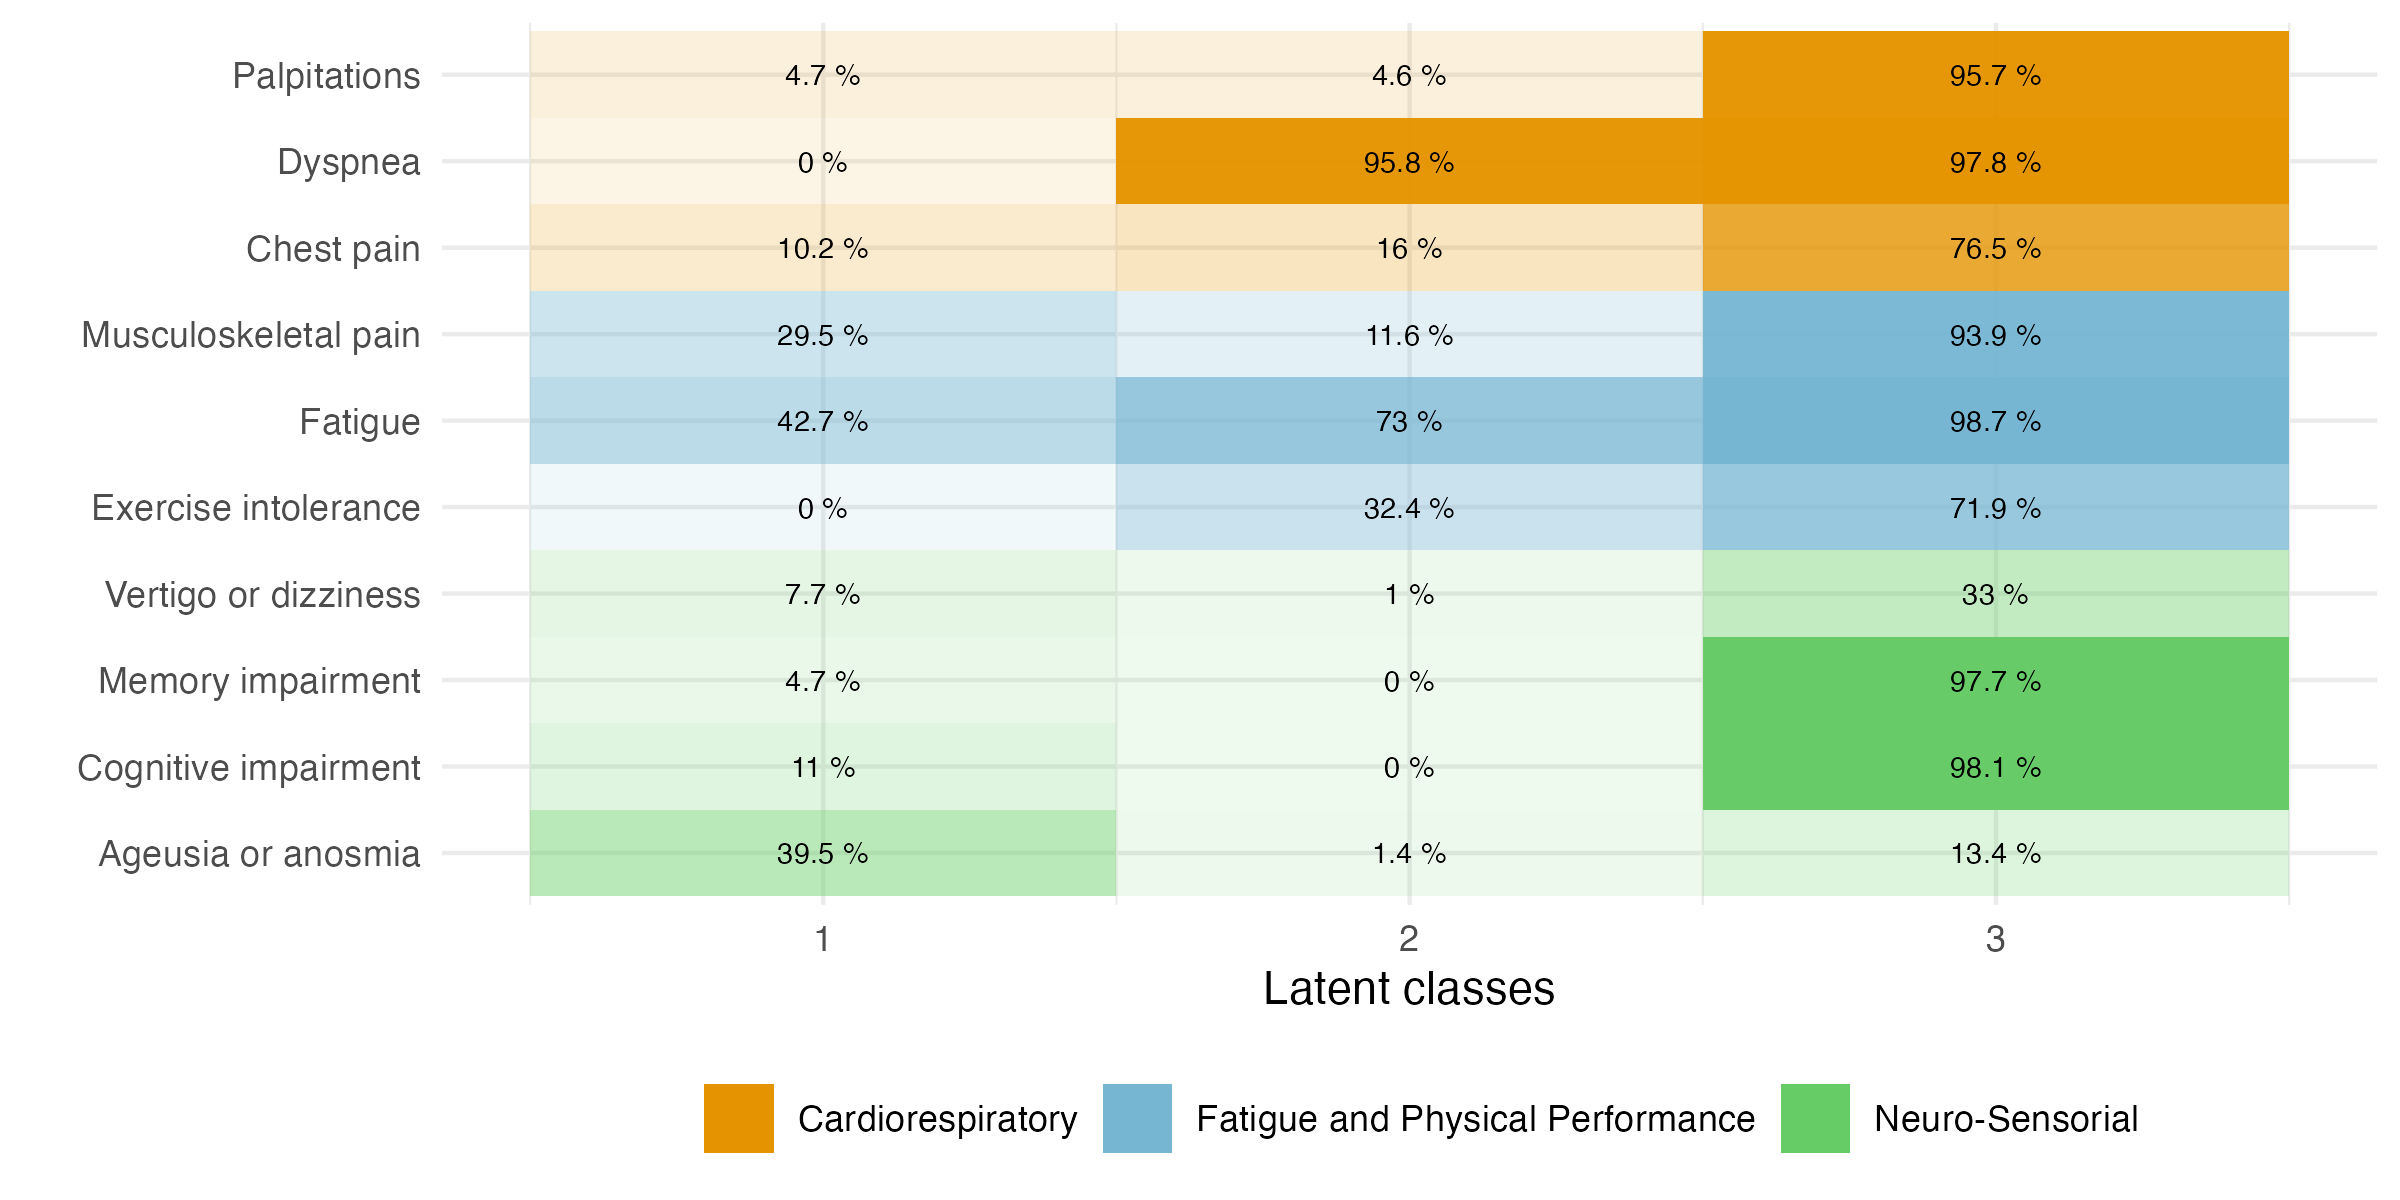
Chart displaying the probability of conditional symptoms across three latent classes. The horizontal axis depicts the three classes (1 to 3) in columns from left to right. The vertical axis depicts symptom probability. Each column represents the probability of symptom occurrence, with dark colors indicating a higher probability. Symptoms are colored by domain: cardiorespiratory (brown), fatigue and physical performance (blue), and neuro-sensorial (green).
Source: Prepared by the authors of this study.
Source: Prepared by the authors of this study.