Estudios originales
← vista completaPublicado el 27 de noviembre de 2017 | http://doi.org/10.5867/medwave.2017.09.7083
Desigualdades en salud, su impacto sobre la prevalencia de factores de riesgo cardiovascular y el desarrollo de sus complicaciones crónicas en Argentina: estudio sobre Encuesta Nacional de Factores de Riesgo
Health inequalities and the impact on the prevalence of cardiovascular risk factors and chronic complications in Argentina: a study on national risk factors surveys
Abstract
BACKGROUND In Argentina, there is evidence of health inequalities, measured both at the general level and also using income as a parameter of social status. However, few studies address the issue of health equality in chronic diseases such as cardiovascular risk factors.
OBJECTIVE To describe health inequalities, using cardiovascular risk factors as a tracer for chronic diseases in different areas of the country and over time. In addition, we aim to identify differences in the quality of care provided to people with cardiovascular risk factors, between 2005 and 2009.
METHODS This is an observational study, which used descriptive and quantitative methods. Data from the National Risk Factors Survey from 2005 and 2009 in the cohorts who have chronic diseases (hypertension, diabetes, dyslipidemia and overweight/obesity) were analyzed to assess associations between health status and several demographic, epidemiological and socioeconomic variables. Additionally, clinical and metabolic characteristics of people with diabetes and other cardiovascular risks factors were analyzed in 2005 and 2009 using the database Quality of Diabetes Care (QUALIDIAB).
RESULTS Cardiovascular risk factors are more frequent in people with lower socioeconomic status, regardless of the indicator. The inequalities detected showed the worst indicators in strata with lower education and income, with the same results both nationwide and separated by region. This inequalities were more pronounced in 2009, and their magnitude changed by region and cardiovascular risk factor. From 2005 to 2009, body mass index, blood glucose and HbA1c value increased. In contrast, both systolic blood pressure and triglycerides decreased, with no significant changes in total cholesterol and diastolic blood pressure.
CONCLUSION Cardiovascular risk factors present inequalities attributed to social status manifesting at both national and regional levels.
Introduction
Improving general level of health, of the population is a high priority for public health, so there is growing concern about the quality and distribution of the services provided [1]. Information regarding health indicators in the country and between subgroups of population suggests the existence of inequities: unfair and avoidable differences in the quality of care provided this is a consequence of factors such as socioeconomic status (education, occupation and wealth level or household income), geographical location, ethnic origin and gender [1],[2]. Therefore, the measurement of inequalities in health is a highly relevant issue throughout the world. Its worldwide increase, and in Latin America in particular, and its consequences (diminution of quantity and quality of life), have determined that its theoretical discussion and critical analysis take priority [3],[4],[5].
In this context, studies on health equity seek to identify which conditions are significantly related to belong or being excluded to a certain social group. Due to its characteristics, this analysis is carried out based on variables that express the social order, which subsequently allows a value judgment to establish about the origin and the unfair nature of the differences [2],[6]. Its objective is to identify, locate, and determine the magnitude of these inequalities and their relationship with socioeconomic variables, in order to develop strategies to overcome them [5],[7].
Chronic non-communicable diseases are the leading cause of death worldwide and their burden is expected to increase, especially in developing countries [8]. Among them, most of the generated load is usually attributed to diabetes, particularly its type 2 form and the associated cardiovascular risk factors: hypertension, dyslipidemia and overweight/obesity.
Worldwide evidence shows that low socioeconomic status increases the risk of developing diabetes and other cardiovascular risk factors [9],[10],[11],[12]. A review of 23 works, from 2011, concluded that the risk of developing type 2 diabetes is significantly associated with low socioeconomic status in high, middle and low income countries [13]. A similar conclusion is reached by the authors of a study carried out in the United States [14]. This increased risk of developing type 2 diabetes is also associated with developing chronic complications [15],[16],[17],[18], which increases the costs of its attention and the inequities mentioned before [19]. It should be noted that increasing efforts are being made to develop effective strategies aimed at specific groups to prevent the development and progression of these diseases. This has promoted the development of numerous studies in developed and high-income countries, in which the socioeconomic patterns of chronic diseases have been verified (socioeconomic gradients) and its temporal evolution [20],[21],[22].
In Argentina, the evidence of inequalities in health has been measured using income as a parameter of social position [23],[24],[25],[26]. However, few studies address this problem related to chronic diseases, particularly cardiovascular risk factors. One of them is a work in 2011, which by a cross-sectional study on the data of the National Survey of Risk Factors of the year 2005, provides evidence about the increased risk of chronic diseases in people of lower socioeconomic status, especially women, and the influence of urbanization on socioeconomic gradients [27]. Likewise, another work from 2013 assesses how the national socioeconomic gradient for sedentary lifestyle, obesity and diabetes changes temporarily. They found that inequality increased between the years 2005 and 2009 and that this increase was greater in women with lower socioeconomic status [28].
However, these studies do not show evidence regarding inequalities at the subnational level (provinces or regions), nor the role of the quality of care of people with cardiovascular risk factors in the development of their chronic complications. Therefore, the present study aims to provide new evidence of inequalities in health, using the cardiovascular risk factors as a tracer of chronic diseases and their temporal evolution at the subnational level. In addition, the study seeks to identify differences in the quality of care provided to people with cardiovascular risk factors at the public subsectors and the Argentine social security. The results will allow obtaining evidence of the existence of inequities and designing effective strategies to correct them.
Methods
Our study is observational and quantitative based on descriptive methods. Secondary sources of information were used, such as the National Survey of Risk Factors for 2005 and 2009 (latest available at the time of this analysis) and the Quality of Diabetes Care database (QUALIDIAB) registry.
The National Survey of Risk Factors is a prevalence or cross-sectional study that is part of the Non communicable Disease Surveillance System of the Ministry of Health of Argentina. The National Survey of Risk Factors included people from the general population ≥ 18 years, not institutionalized, from a sample of homes in cities with more than 5,000 inhabitants across the country. For the calculation of the sample size of each province, a 95% confidence interval was considered, a relative error ≤15%, a design effect of 1.5 and a non-response adjustment of 20% for the lowest expected prevalence (close to 5%). This determined the inclusion of 1,500 to 2,000 persons per province and some urban agglomerates, and a total of 47,159 homes nationwide, where an interviewee was selected using the Kish table. The sampling design of the 2005 and 2009 National Survey of Risk Factors was probabilistic, stratified by conglomerates and multistage, the dwelling was the statistical unit, the household the survey unit and the individual the unit of analysis [29],[30],[31].
The National Survey of Risk Factors 2005 and 2009 was analyzed [29],[30],[31] to evaluate, in the cohorts with hypertension, diabetes, dyslipidemia and overweight/obesity, associations between the state of health and various demographic, epidemiological and socioeconomic variables.
The analysis of the databases was done using two of the most commonly accepted indicators to define socioeconomic position: income level and level of education reached. With these socioeconomic position indicators, inequality was initially analyzed using two simple indicators (the rate differential and the rate ratio), continuing with the concentration index, proposed as one of the best tools to quantify the variation along socioeconomic strata [32].
The differential of rates measures the percentage difference of the least advantageous group versus that with greater possibilities, while the ratio of rates is the quotient between the rates of two groups, with the denominator being the group with the best socioeconomic position. This type of measure based on ranges has two recognized limitations:
- It is not known what happens in the center of the distribution, that is to say, in the intermediate groups between which the inequality can be of any magnitude or can be changing in one or other direction and.
- They do not consider the size of the groups that are object of the comparison.
The second limitation is particularly serious when comparing various scenarios without the same composition and, especially, when the rates of the best group and the worst remain constant. Consequently, the difference as well as the quotient of the rates remain without changes; the situation gets worse if the number or, in particular, the proportion of people increases in the worst group.
The concentration index basically classifies people or households according to some socioeconomic variable. This generates a ranking that reflects the standard of living of the people (socioeconomic position). Usually the income or education variable is used, which is compared with the distribution of the variable of health of interest [33]. If the distribution of the health variable favors those with the best socioeconomic status (rich), the indicator will be positive. Conversely, it will have a negative sign when the distribution of the variable favors those with the worst socioeconomic position (poor). The limit of the indicator is 1 in absolute value, so, the closer the index is to 1, the higher the socioeconomic concentration of the health variable. The value 0 indicates total equality [34].
The data of the National Survey of Risk Factors were analyzed at the national level and by geographical jurisdiction considering the regions proposed by the National Institute of Statistics and Census. For the analysis of the simple indicators, the income level was stratified into three levels according to the methodology of the National Institute of Statistics and Census: low income (the four poorest income deciles), middle Income (the next four deciles) and high Income (the two highest income deciles). The deciles of income were determined based on the monthly household income reported in the National Survey of Risk Factors. In the same way, reached education was stratified: low education (up to incomplete primary), middle education (complete primary and/or incomplete secondary) and high education (at least complete high school or more), not considering people with special education. The STATA 8.0 Standard Edition software was used for the calculation of the concentration index and the socioeconomic position variables without stratifying were considered.
In addition and using the database of the QUALIDIAB registry [35], the clinical and metabolic characteristics of people with diabetes and other cardiovascular risk factors were analyzed in two periods: 2005 and 2009. QUALIDIAB is an anonymous systematic registry that includes indicators of quality of care for people with diabetes [35]. All consecutive records were considered, corresponding to people between 18 and 75 years of age of both genders, registered in the QUALIDIAB database from January to December 2005 and the records entered in the same database during the whole year 2009. In each of the cohorts the following clinical-metabolic parameters and their temporal evolution were verified: age (years), weight (kg), body mass index (kg/m2), waist circumference (cm), hip (cm), fasting blood glucose (mg/dl), HbA1c (%), systolic and diastolic blood pressure (mmHg) , total cholesterol (mg/dL), HDL cholesterol (mg/dL), LDL cholesterol (mg/dL) and triglycerides (mg/dL). Also, quality indicators of care provided, were studied based on the proportion of patients in treatment goal according to international guidelines (body mass index <25 kg/m2, systolic and diastolic blood pressure <130 and 80 mmHg respectively, blood glucose <100 mg/dL, HbA1c <7%, total cholesterol <200 mg/dL and triglycerides <150 mg/dL).
Statistical analysis of the results was performed using SPSS 15 and STATA 8.0 SE software. The continuous variables: age (years), weight (kg), body mass index (kg / m2), waist circumference (cm), hip (cm), fasting blood glucose (mg / dl), HbA1c (%), systolic and diastolic blood pressure (mmHg), total cholesterol (mg/dL), HDL cholesterol (mg/dL), LDL cholesterol (mg/dL) and triglycerides (mg/dL) were shown as means and standard deviations (SD); and the categorical variables as proportions. Differences of means were verified for the 2005 and 2009 cohorts, by using the t-Student test and proportions with Chi2 test. The level of significance was established at p <0.05.
Results
Initially an inequality analysis was carried out with the simple indicators (the rate differential and the rate ratio), and then continue with more robust indicators, such as the concentration index. Simple indicators show that considering education as an indicator of socioeconomic status, diabetes and cardiovascular risk factors are more frequent in people with lower educational levels, both for years 2005 and for 2009 (Figure 1). It can also be seen that in 2009 there was an increase in the percentage of people with high cholesterol and obesity at all the levels considered. Additionally, a high educational level was associated with a better self-perception of their health status and a higher percentage of people with health coverage in both periods. It should be noted that comparing the 2005 period with 2009, there was a poor perception increase in the state of health - regardless of the social position considered - even when in that period an increase in health coverage was verified.
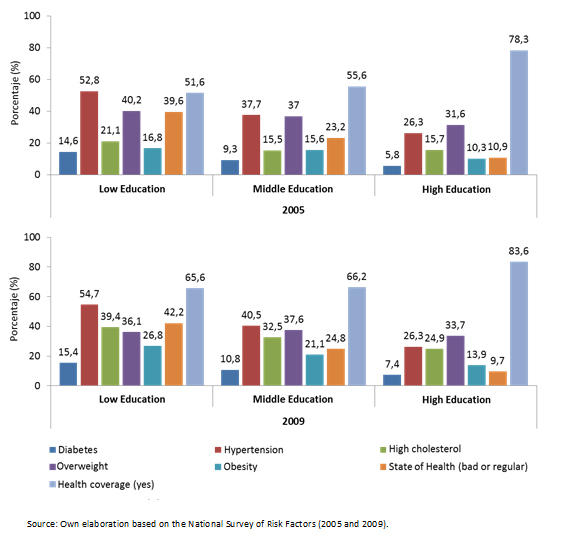 Full size
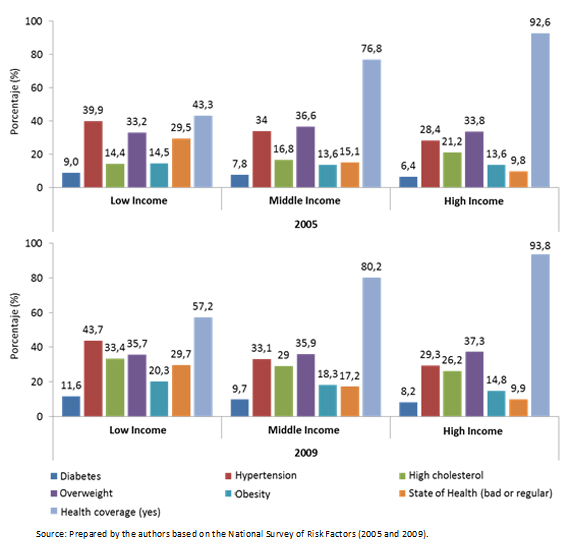
 Using the income level as an indicator of social position, similar results were obtained in terms of perception of the state and health coverage showing a similar change and improvement as a function of income (Figure 2). In this case, however, the dissociation between health status and level of coverage in the 2005 and 2009 periods was not recorded. Regarding the percentages of frequency of the cardiovascular risk factors considered, the percentage of elevated cholesterol increased in 2005, overweight did not show changes (2005) or a tendency to increase (2009), and obesity in 2005 showed small changes depending on the improvement of social position. This suggests that the choice of the social position indicator would have a marked impact on the results and conclusions obtained.
 Full size
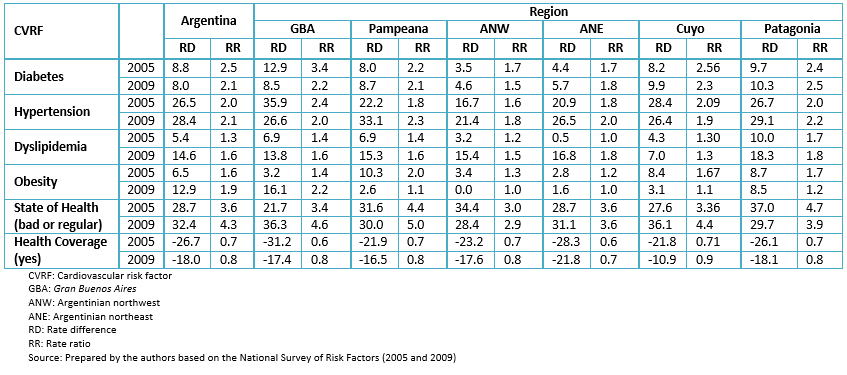
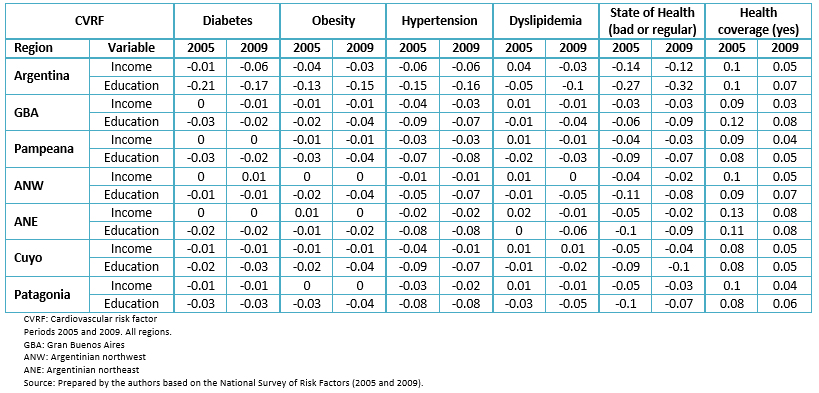
 Table 1 shows the indicators of inequality (difference and rate ratio) registered between groups, considering education as an indicator of socioeconomic status. Some inequality can be observed in the prevalence of cardiovascular risk factors according to social position at the national and subnational levels (regions). Likewise, from 2005 to 2009 in both levels there was an inequality increase in all cardiovascular risk factors, with the exception of diabetes. These changes showed a correlation with the state of health (bad / regular) but not with the health coverage that again showed an increase both at a national and regional level.
 Full size
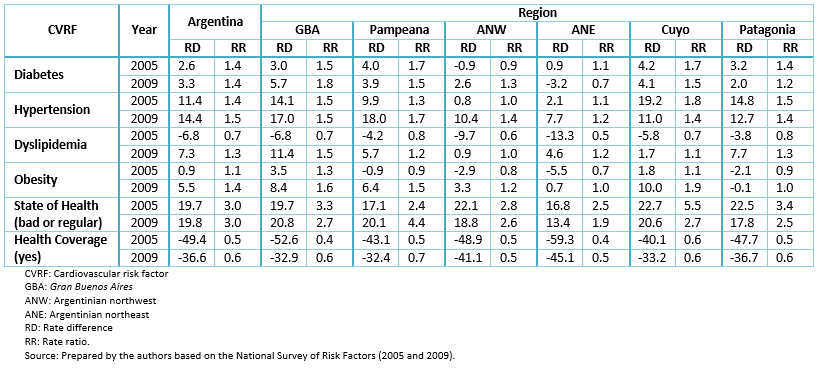
 In Table 2 the results of the indicators are presented, considering the income as a parameter of socioeconomic position. It can be seen that the changes recorded are similar to those observed in Table 3, although with less magnitude. It is again observed that perception of health status deteriorates even when the degree of coverage increases from 2005 to 2009, a phenomenon that is repeated at the national and regional levels.
 Full size
 Given that the results presented in Tables 1 and 2 show some inequality among socioeconomic groups, we used the concentration index, a more robust indicator, to measure inequalities (Table 3). As shown in the table, most of the concentration index have a negative sign in the cardiovascular risk factors and the self-reported health status (bad and regular), showing the existence of inequality, due to a greater concentration of these risk factors on the population with fewer possibilities. This inequality becomes more evident using education as a variable of social position. Regarding health coverage, the positive sign informs us of a concentration of the availability of coverage in the population with the greatest resources. In terms of regions, the indicator tends to be close to zero (except for hypertension, self-reported health status and health coverage), a fact that suggests the absence of notorious inequalities at the intraregional level but present at the interregional level.
 Full size
 Diabetes shows a pro-poor inequality, using both variables of social position, a fact that becomes more evident when the variable education is used. From 2005 to 2009, the analysis changes depending on the variable considered: using income we see how inequality increases at country level, while education decreases.
Hypertension shows a pro-poor inequality, and in terms of the index of concentration measured according to income inequality (concentration index = -0.06) it is the most noticeable among the cardiovascular risk factors and constant between both periods. At the regional level, unlike the other cardiovascular risk factors, intra-regional pro-poor inequalities are notorious.
With high cholesterol, something different to the other risk factors happens. In 2005, the concentration index, measured with income, is positive suggesting that the population with higher income has a higher concentration of it; this situation reverts in the following period. In contrast, measuring inequality with the level of education, in both periods is negative (pro-poor inequality), with the singularity that it doubles in the period of 2009.
For self-reported health status (poor or fair), measuring the concentration index with income or education, inequality is notorious nationally and in all regions. For Argentina, using the concentration index with income, inequality from one period to another decrease; instead, when using education as a variable of social position, it increases.
The positive sign of health coverage shows us that there is a concentration of coverage in the population with the greatest resources. Using indistinctly, either of the two variables of social position to measure inequality, there is evidence of a notable decrease in the 2009 period.
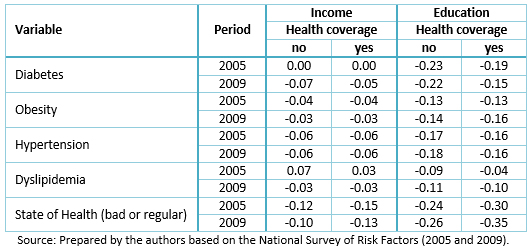
The repetition of the analysis of the concentration index only at the country level, using both variables of social position, but segmented according to availability of health coverage, showed that for diabetes, the population with the lowest educational levels and without coverage, has a pro-poor inequality in both 2005 and 2009 (Table 4). Using income as a variable, in 2005 there seems to be no difference between having or not having coverage, but there is a difference for 2009. For obesity and hypertension the differences are not significant using income or education as a variable of social position. Using income as an indicator of inequality, we verify that in 2005 the population without coverage and with higher income presented a higher prevalence of dyslipidemia. Instead, when using education to measure inequality, in both periods, the population without coverage and with less formal education showed greater inequality than those who possess it.
 Full size
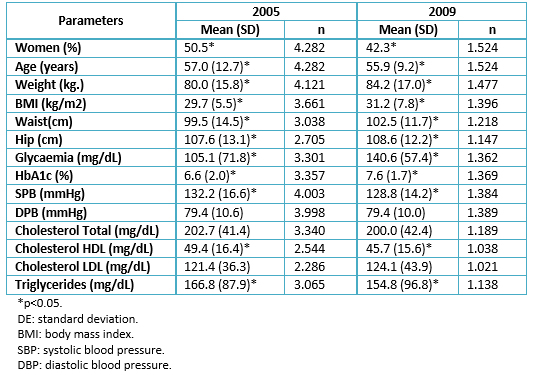
 In addition, 5,806 records were analyzed from the QUALIDIAB database, of which 4282 corresponded to the year 2005 and 1,524 to the year 2009. Table 5 shows clinical and metabolic characteristics of each cohort. It can be seen that in the period from 2005 to 2009, values of body mass index, glycaemia and HbA1c increased, while those of systolic blood pressure and triglycerides decreased. No significant changes are observed in total cholesterol and diastolic blood pressure.
 Full size
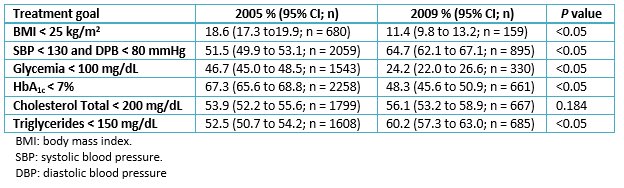
 When we verified quality of care provided to these people, using as an indicator the percentage of patients in the treatment goal, we found that in this period, this percentage decreased for body mass index and glycemic control (Table 6); on the contrary, the percentage of patients with good control of blood pressure and triglycerides increased, without registering significant changes in cholesterol control.
 Full size
 Discussion
Our results show that health of our population presents inequalities conditioned by their social position, in this case referred specifically to cardiovascular risk factors. These were evaluated using impartial indicators referring to the risk factors themselves (prevalence), health coverage of those who suffer them and other impartial indicators such as self-perception of the State of Health of those who have cardiovascular risk factors.
The social position of people was evaluated according to their income and educational level and the mentioned inequalities varied according to the indicator used, showing that the selection of the indicator conditions the results obtained.
In general, inequalities detected showed worse indicators in the strata with lower education and income, manifested at both national and regional levels, being generally more accentuated in the last year registered (2009) and its magnitude varied according to measurement period, year, region and cardiovascular risk factor considered.
This association of the worst indicators with lower social status strata showed a clear relationship with a worse self-perception of their state of health. This association of both objective and subjective low indicators with social status was observed in both periods of the study even in 2009 when an increase in the health coverage was verified regardless of the stratum considered. This suggests that increasing the coverage does not automatically or significantly repair levels of inequality. Similar results have been described by other authors in different latitudes and health contexts [36],[37].
Based on these results, we should assume that solving the problem of inequalities requires something more than a simple increase in the accessibility to control and treatment via increased coverage. In this sense, Monteiro de Andrade et al. argue that biomedical health models are useful to reduce the adverse consequences of diseases, but are insufficient to effectively improve the health of people or populations and promote health equality [38].
In addition, indicators used to measure quality of care provided to people with diabetes and other cardiovascular risk factors (clinical and metabolic values as well as percentage of people in therapeutic goal), in the same periods (years 2005 and 2009) showed suboptimal values especially in the case of measurement of obesity and glycaemia. These values are similar to those described for other countries in Latin America [39], and allow predicting that these people will develop chronic complications that will increase their cost of care, increasing the current problem.
Overall, our data, like those of other authors, suggest that poverty would increase the risk of developing diabetes and other cardiovascular risk factors, which would induce a worse self-perception of health. On the other hand, low quality of care provided to people with diabetes and associated cardiovascular risk factors would facilitate the development and progression of complications [39]. The development of diabetes and associated cardiovascular risk factors, and of these complications, would generate more poverty with the establishment of a vicious circle that would increase the existing inequalities [40].
Conclusions
In this situation, it is worth asking what strategies would be effective to solve or at least significantly reduce the problem of the described inequalities.
As we stated earlier, the solution is not simple and implies a multidisciplinary and intersectoral approach. Improving social determinants of health requires participatory and intersectoral policies and actions (economy, education, transport and housing, among others) the health sector can act as the guiding leader of this actions tending to correct existing inequalities [38].
We also believe that the primary care level should be the scenario where these strategies are implemented because this is where people enter the health system and consequently where it can achieve greater impact and efficiency.
Notes
From the editor
The authors originally submitted this article in Spanish and subsequently translated it into English. The Journal has not copyedited this version.
Ethical aspects
The Journal is aware that the Ethics Committee of the Latin American School of Bioethics (CELABE), La Plata, Argentina, learned about this study and its possible publication in a biomedical journal.
Declaration of conflicts of interest
The authors have completed the ICMJE conflict of interest declaration form translated into Spanish by Medwave, and declare that they have not received funding for the report; have no financial relationships with organizations that might have an interest in the published article in the last three years; and have no other relationships or activities that could influence the published article. Forms can be requested by contacting the author responsible or the editorial management of the Journal.
Acknowledgements
The authors thank Enzo Rucci for organizing and managing the QUALIDIAB database. For more information about the QUALIDIAB network and its registrations, please visit (free of charge) its website (www.cenexa.org/qualidiab).
Financing statement
This research work was carried out with the support of the "Ramón Carrillo-Arturo Oñativia" scholarship program, awarded by the National Ministry of Health through the National Health Research Commission.
