Práctica clínica
← vista completaPublicado el 9 de diciembre de 2024 | http://doi.org/10.5867/medwave.2024.11.2966
Conceptos actuales sobre el uso del partograma para vigilar la progresión del trabajo de parto
Current concepts on the use of the partogram to monitor labor progression
Abstract
The partogram is a graphic tool used to monitor labor progression. This article reviews the recent literature on the use of the partogram, aiming to evaluate whether its implementation reduces cesarean section rates and to determine which model is more appropriate. Studies that compared using the partogram with not using it were analyzed, as well as studies that contrasted different partogram models. The results indicate that partogram use is not associated with a significant reduction in cesarean section rate, particularly in countries with low cesarean section rates. However, the modified World Health Organization partogram, which eliminates the latent phase, appears to have advantages over the classic 1994 model, with significantly lower cesarean section rates. Although the partogram has not shown significant benefits in reducing cesarean sections, it is still a useful tool for graphically documenting the progress of labor, which could improve clinical decision-making. In Chile, the high cesarean section rates, close to 45%, suggest that implementing the WHO 2000 partogram could be beneficial. However, local studies are needed to confirm the potential benefits of reducing cesarean sections.
Main messages
- The partogram is a graphic representation of labor progression.
- The partogram has not been effective in reducing cesarean section rates in countries with low cesarean section rates.
- The new partogram of the World Health Organization published in 2000 is recommended.
Introduction
The partogram is a graphic representation of labor progression. It records the dilation of the cervix (in centimeters) and the descent of the fetus (spines) over time [1]. The first partogram was published in 1972. Since then, new designs have been created to graph and interpret the development of labor without reaching a consensus on which model to use [2].
Dystocia, characterized by slow and abnormal progression of labor, is the most common indication for cesarean section. It has been postulated that the best way to monitor the progression of labor is by using the partogram [2].
This paper aims to review recent clinical research on using the partogram to show whether it can reduce the cesarean section rate and determine which partogram model would be most appropriate.
The partogram
The partogram is a preprinted chart, which the healthcare professional in charge of labor care should complete. The hours of labor are represented on the horizontal axis, and the centimeters of dilatation and the descent of the presentation are represented on the vertical axis.
The partogram is started by plotting the normal pattern on it. That is the normal speed at which cervical dilatation occurs, considering the patient’s clinical characteristics, such as parity, state of the ovular membranes, use of anesthesia, position of the patient, and variety of positions of the presentation. This normality pattern is called the “alert line” (Figure 1). Some partograms assume that, during the active phase, dilatation progresses one centimeter per hour, thus plotting the “line of action”. Others indicate progressive dilation rates on the partogram itself, generating a warning line that is not straight but an ascending curve (Figure 1) and adjusted to the patient’s clinical characteristics. In these ascending lines, for example, the speed is higher in multiparous and ruptured membranes than in nulliparous and/or intact membranes.
Filling of partogram and types of partogram.
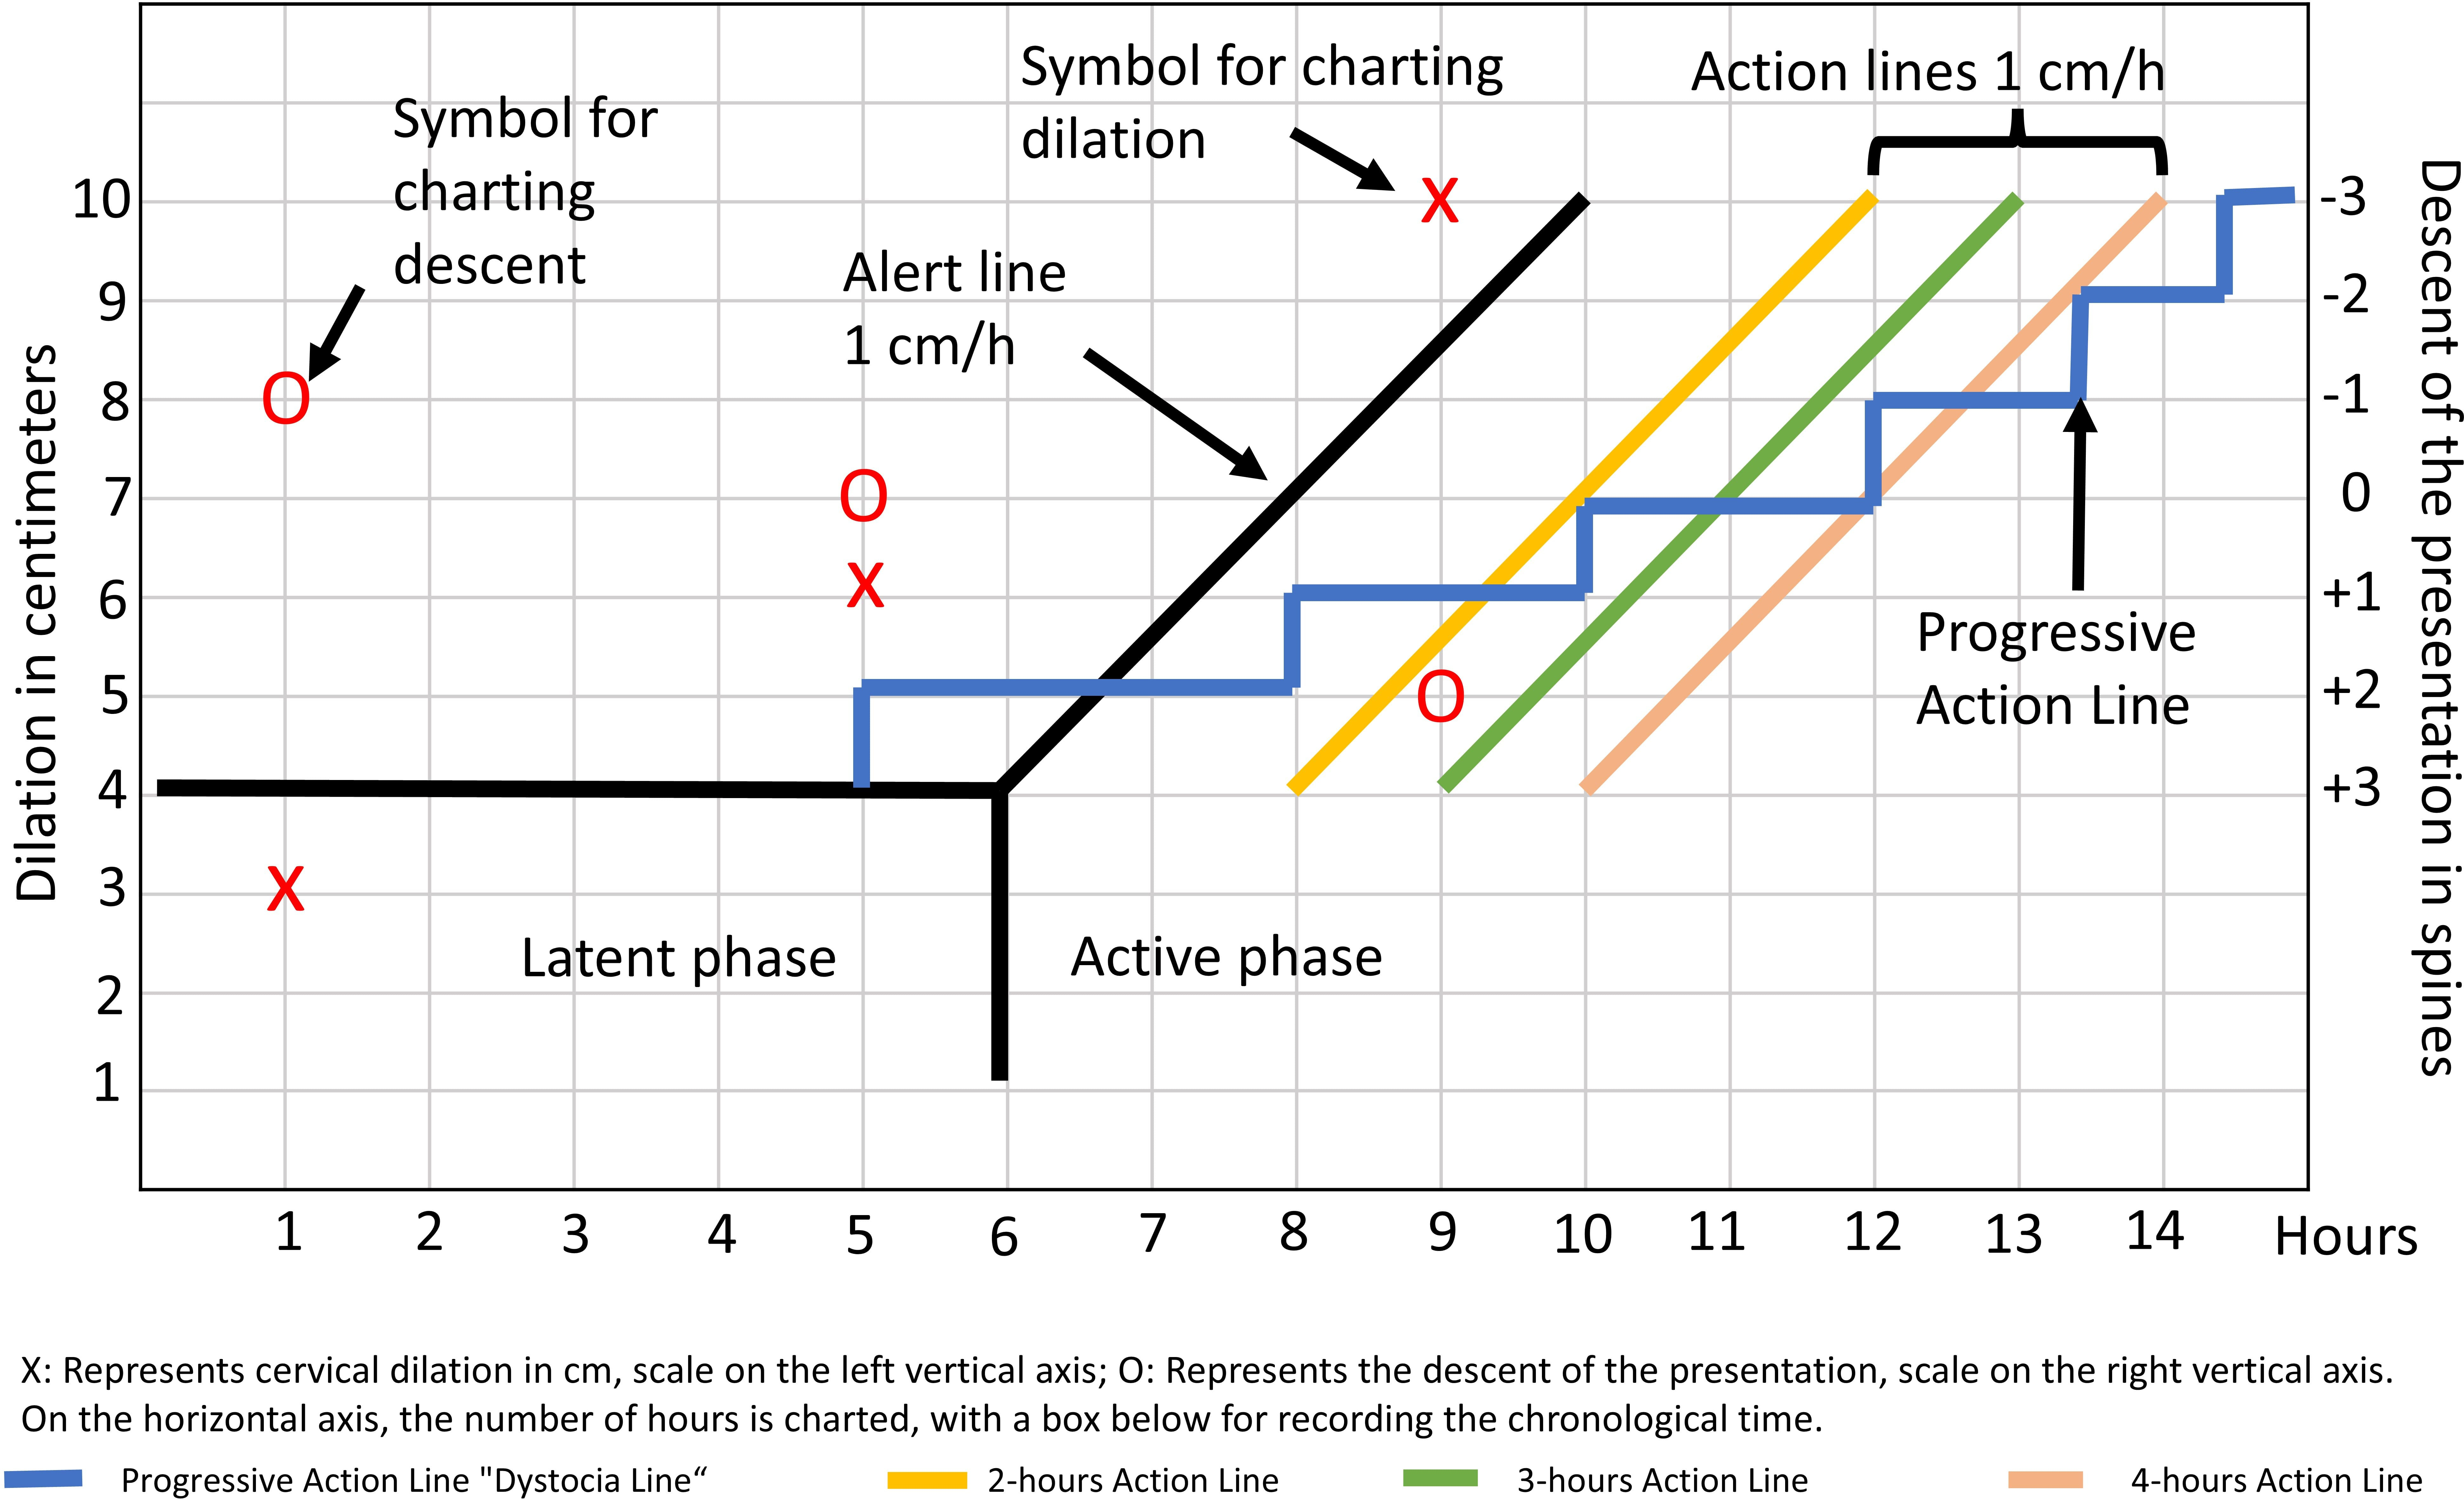
Then, progressively as vaginal examinations are performed, the dilatation and descent of the presentation are recorded, together with other clinical characteristics such as fetal heart rate, patient’s position, state of the ovular membranes, use of anesthesia, variety of position, etc. If the patient’s progression graph exceeds the warning line (to the right), it indicates that the progression of labor is slower than normal.
Some partogram models (Figure 1) include a second line, called the “action line,” plotted parallel to the alert line at different times depending on the different partogram models. If the patient’s dilatation graph exceeds the action line, it is concluded that we should apply some intervention, such as oxytocic acceleration, or define the need for cesarean delivery [3].
Partogram versus no partogram
Two randomized trials (2332 patients) have compared the use versus non-use of partograms to monitor labor progression [1,4]. Meta-analysis of the raw data from these two investigations showed that partogram use is not associated with a significant reduction in cesarean section rates (partogram versus non-partogram group cesarean section rate: 23.3 and 24.1%, respectively RR: 0.95; 95% CI: 0.51 to 2.38). The women included in these investigations came from either high [1] or low-income populations [4], but both with low cesarean rates.
Differences between partogram models
Six studies have compared birth outcomes by implementing different partogram models [2,5,6,7,8,9].
One-line partogram (alert) vs. two-line partogram (alert and action)
A randomized controlled study compared aggressive labor management using a single-line partogram (alert) with expectant management involving a two-line partogram (alert and action). This study demonstrated a lower cesarean section rate in the one-line partogram group versus the two-line partogram group (16 versus 23.4%; RR: 0.68; 95% CI: 0.50 to 0.96) [9]. It should be noted that labor was managed unequally (aggressive versus expectant) between the two groups studied and not only by a different partogram. For this reason, such findings should not be generalized.
Single-line of action partogram versus dystocia line partogram
The dystocia line postulates that the time required to dilate one centimeter to the next is variable in early active labor; thus, it is not a straight line as if dilating one centimeter per hour, but corresponds to a staggered line where dilating could take more than one hour (Figure 1). The randomized clinical trial (228 women) demonstrated no differences in cesarean section rates (14.9 versus 18.5%, dystocia line vs. action line group; RR: 0.87 95% CI: 0.59 to 1.27) [2]. The investigators additionally observed low partogram fill rates (67% in the dystocia line and 43% in the action line partograms).
Partograms with different lines of action
A randomized study (519 patients) compared the cesarean rate in three groups using the partogram with three different lines of action at 2, 3, and 4 hours (Figure 1), demonstrating no changes in cesarean rates (12, 14 and 9%, respectively, p = 0.269) [7].
WHO partogram 1994 versus WHO partogram 2000
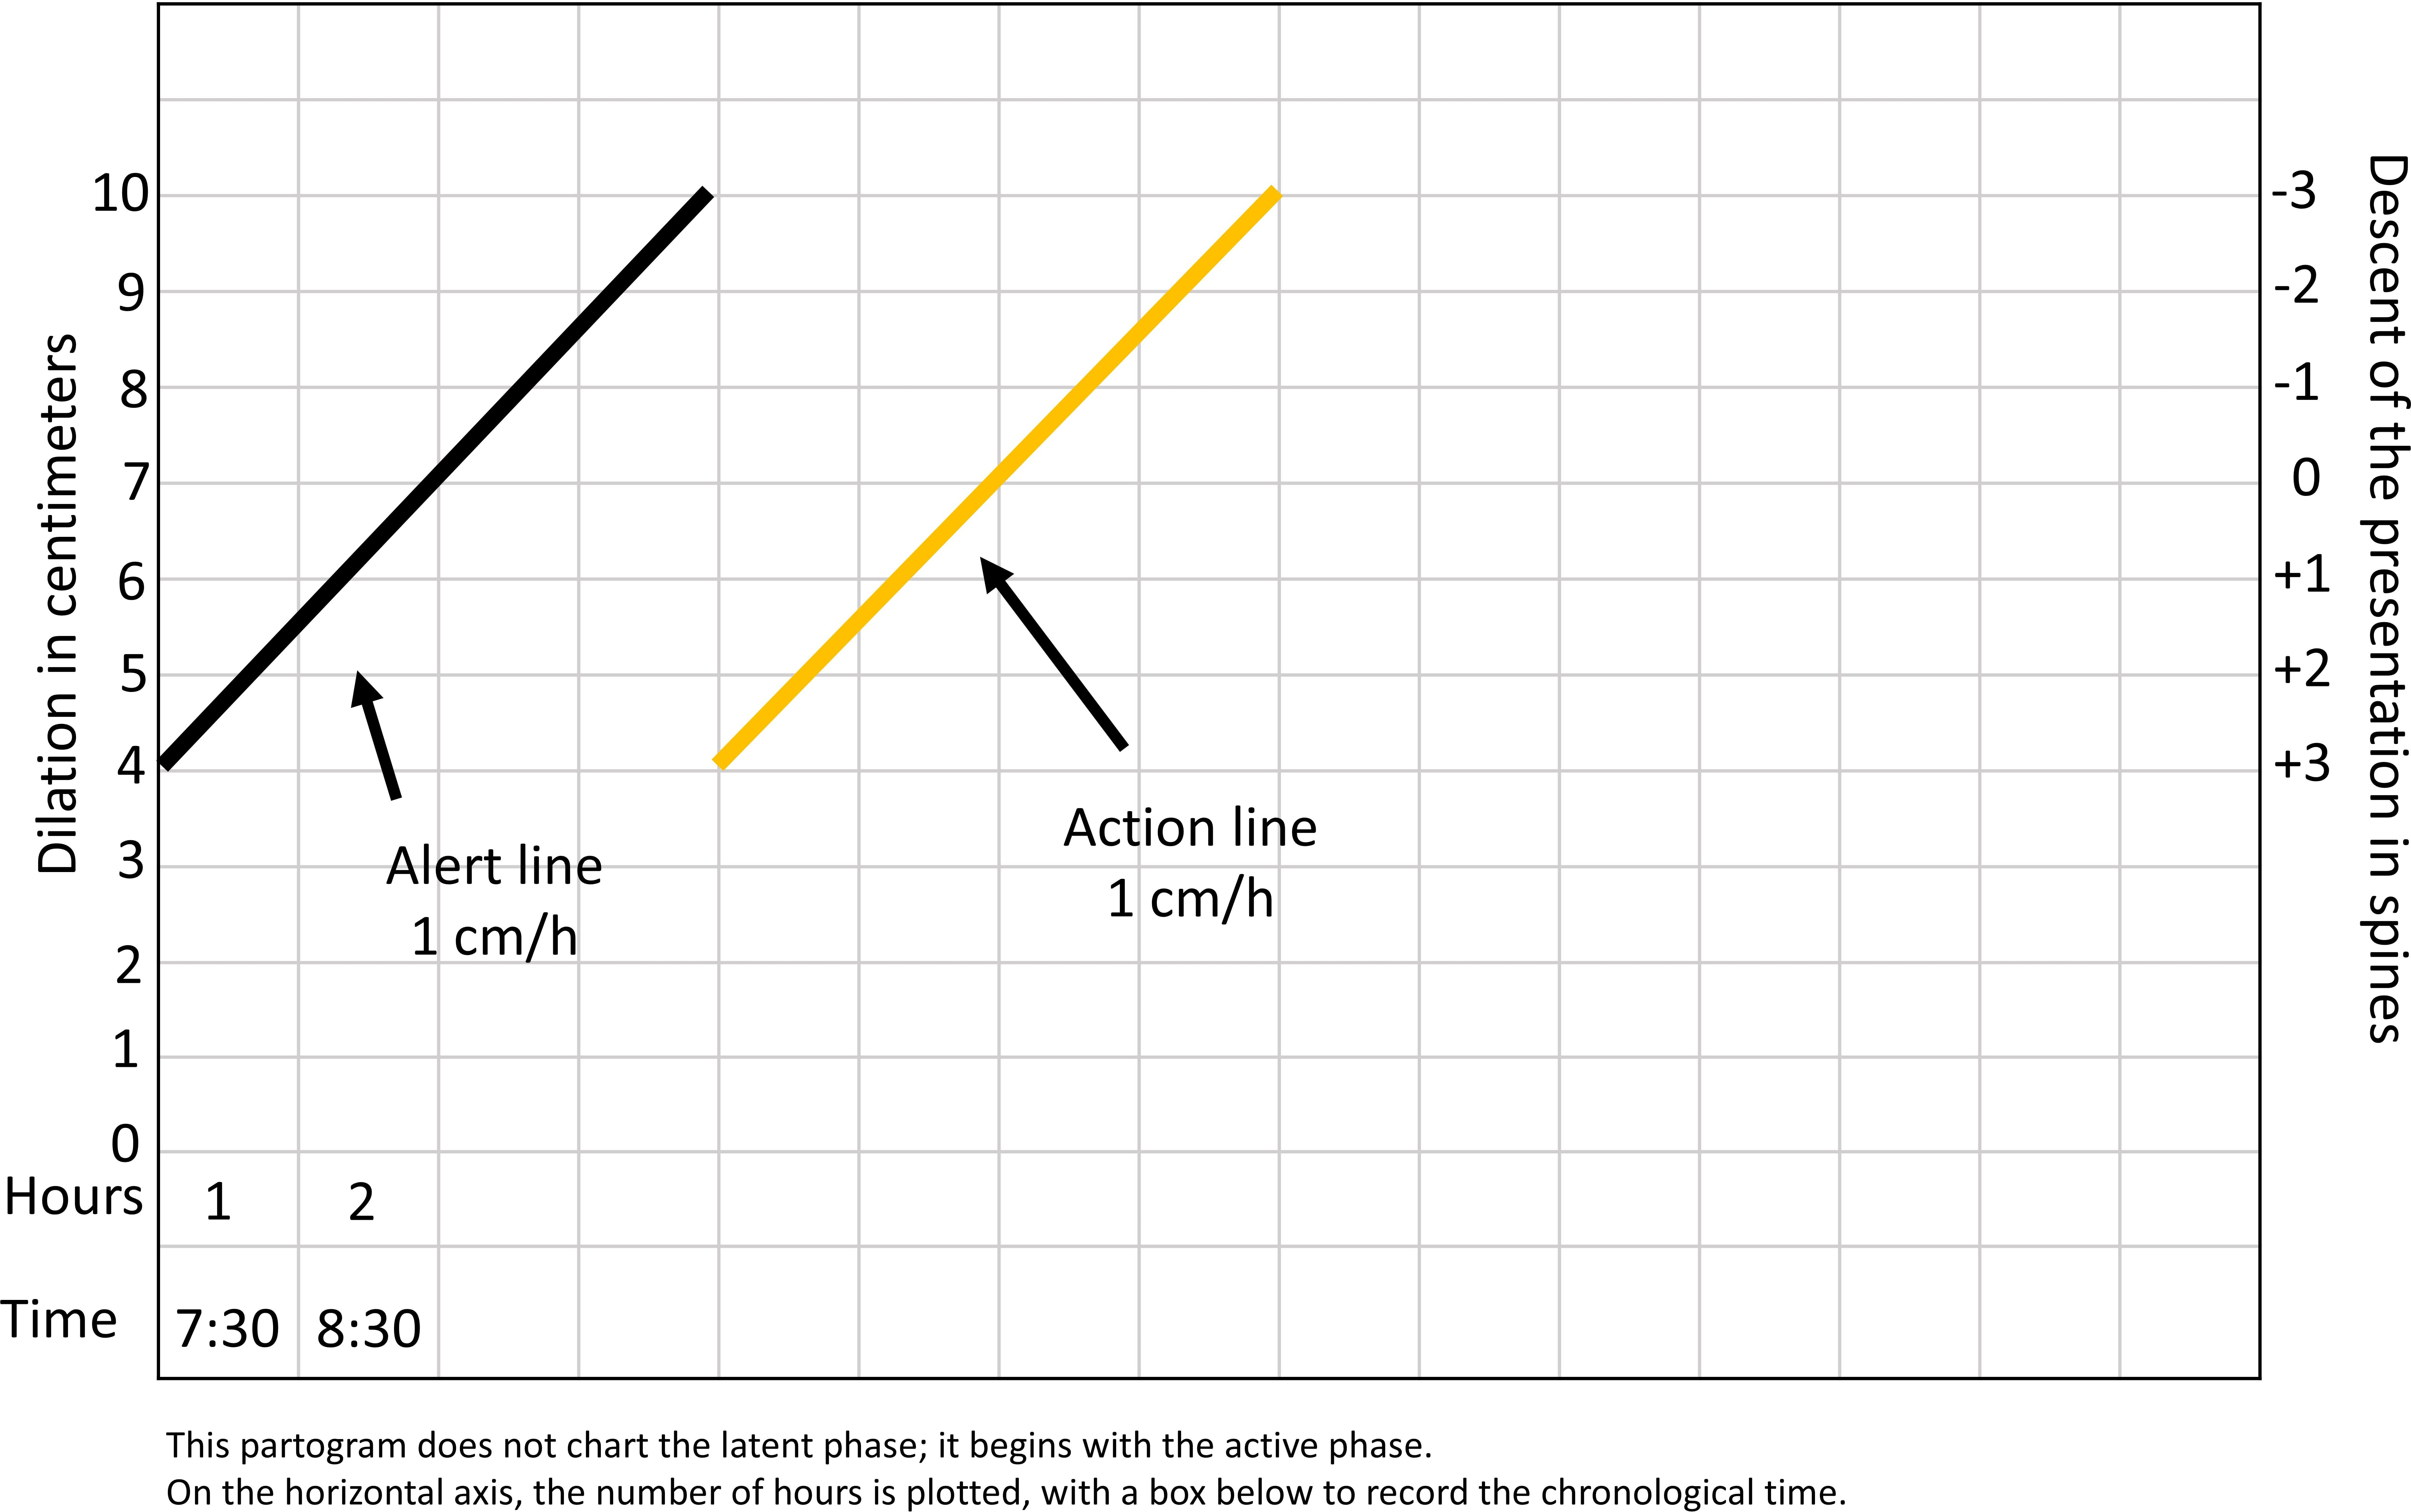
Two randomized studies (883 patients in total, in low-income countries) compared the use of the modified partogram proposed by the World Health Organization (WHO) 2000, corresponding to a partogram that begins recording in the active phase at four centimeters of cervical dilatation (Figure 2), against the control group with the classic partogram (proposed by WHO in 1994), which included in the graph a latent phase that could last up to eight hours. The cesarean section rate was calculated in a meta-analysis, showing that in the modified WHO 2000 partogram group, it was significantly lower than that of the classic partogram group (8.9 versus 21.9%; OR: 0.35; 95% CI: 0.34 to 0.57) [5,6]. It should be noted that the WHO partograms create the line of action, assuming a dilation rate of one centimeter per hour during the active phase.
Representation of the World Health Organization Partogram model version 2000.
Discussion
This update reviewed recent research on the use of the partogram as a tool to monitor labor and reduce cesarean section rates. Firstly, it was possible to observe that using the partogram does not reduce cesarean section rates. Secondly, it was determined that the one-line partogram seems to be better than the two-line partogram and that using the new partogram published by WHO in 2000 is associated with a significant reduction in cesarean section rates compared to the 1994 WHO partogram. In conclusion, it should be noted that the research was carried out in places with low cesarean section rates. This makes it difficult to generalize these results to Chile, which has high cesarean section rates.
The meta-analysis presented in this article demonstrates that the use of the partogram did not lead to a reduction in cesarean section rates. In the most recent systematic review, including 11 articles that used the partogram as a study variant, the conclusion was similar to ours, showing that using partograms does not reduce cesarean section rates [10]. Despite the lack of benefit, it is evident that the partogram plays a fundamental role in recording labor progression, as it is a better visual tool than written notes.
The results suggest that the one-line partogram seems to be better than the two-line partogram (action and alert), probably because it simplifies registration. However, the study that performed this analysis has an intervention bias (active versus expectant management) that renders the results presented invalid.
In addition, it was possible to observe that the modified WHO 2000 partogram model was superior to the classic model proposed by them in 1994. There is no comparison between this new partogram and the non-use of partogram to argue that it allows a reduction in the cesarean section rate. However, being better than the one proposed in 1994, it seems reasonable to implement its use and to study in a controlled clinical investigation whether the use of this partogram is better than not using it for labor management and thus reduces the cesarean rate.
The WHO has recommended the universal use of the partogram since its pioneering studies in Asia, concluding that the partogram is a necessary tool for labor surveillance [3]. They demonstrated a reduction in prolonged labor, the proportion of labors requiring oxytocic acceleration, emergency cesarean section, and a decrease in stillbirths with the use of the partogram [3].
These WHO partograms create a line of action with a speed of one centimeter per hour, while other models generate the line of action as a progressive curve (faster dilation speed as dilation progresses). More recent evidence suggests that this progressive curve is more accurate in characterizing cervical dilation during labor. However, there is no evidence to support that a partogram with an ascending line is better than the classic straight line used by the WHO.
In Chile, the Perinatal Guide 2015 suggests using partograms, indicating “use partogram of dilatation and descent especially when the progression is not as expected”. However, the partogram model to be used is not made explicit, nor is it an obligation. Perhaps for this reason, the use of partograms is not routine in Chilean hospitals. On the other hand, the Ministry of Health has reported that in Chile, the cesarean section rate is higher than recommended, being close to 45% of deliveries. This cesarean rate is much higher than that of the studies we reviewed in this research (20%). Although the use of the partogram did not reduce cesarean section rates in countries with low rates, it is not possible to extrapolate these results to Chile, a country with high rates.
Conclusions
The background presented in this article demonstrates that using partograms does not significantly reduce cesarean section rates in countries with low rates. Nevertheless, the WHO recommends its use. There is no superiority of one partogram model over others. However, the WHO 2000 model, which does not plot the latent phase, may result in better labor management. It is possible to recommend using the OMS 2000 partogram in Chile as a useful strategy to improve labor registration. Eventually, it would help to reduce the high cesarean section rate.
