Notas metodológicas
← vista completaPublicado el 29 de agosto de 2018 | http://doi.org/10.5867/medwave.2018.04.7237
Índice para cuantificar la responsabilidad social individual en la decisión de vacunarse
An index to quantify individual social responsibility in the decision to be vaccinated
Abstract
In the context of generic infectious disease studies, the aim of this paper is to quantify and represent the individual social responsibility based on whether or not a single individual is vaccinated. Although the objective of this study is merely educational the approach implemented is based on a classical mathematical model named S.I.R. (Susceptible-Infected-Recovered) using an impulsive vaccination strategy. Dates of vaccination and fraction of individuals vaccinated are used as parameters. In addition, numerical simulations are conducted to represent the outcomes regarding the reduction of infected cases through tables and graphs.
|
Key ideas
|
Introduction
In recent years, fear of global immunization processes has grown worldwide. A now-retracted study asserting an association between serious diseases in infants in the United Kingdom who received the MMR vaccine[1] helped fuel this collective rejection of vaccination, driven by the public’s perception of conflicts of interest between health professionals, the pharmaceutical industry, and the mass media.
At the same time, new outbreaks of infectious diseases in different parts of the world, which were, in general, controlled, made the news[2],[3]. These include measles cases reported in Europe[4] and, more recently, Latin America, a region that was free of the disease[5]. While no measles cases have been reported in Chile in the past few years[6], myths and false beliefs about vaccination that have arisen in the collective imagination could harm optimal implementation of future immunization campaigns as a preventive measure[7].
In recent years Chile has made significant efforts to ensure the population receives all necessary vaccines, including, among others, whooping cough[8], and influenza (2018)[9]. In 2017, Ministry of Health authorities reported cases of whooping cough in the Maule Region of central Chile, with serious consequences among mothers who were nursing[10]. A vaccination program for pregnant women was launched immediately, run by the regional health body. In addition, in 2018, new outbreaks of mumps were recorded in Chile’s central and southern zones[11], which led to efforts to strengthen the public health prevention network.
While the decision to vaccinate against infectious diseases is an autonomous one, some research stresses the need to connect the choices that are made to social responsibility ethics and the concept of the common good[12]. According to the authors of this research the decision to vaccinate (or not) has social as well as personal consequences that can cause changes in the chain of infection and generate economic burdens for society[12]. The general public is not always aware of these effects.
We need to educate the general public about the benefits of vaccines in order to eradicate infectious diseases and reduce mortality rates among those most vulnerable. This can be achieved through multiple approaches, using diverse arguments, in public education campaigns. To contribute to this goal, this article uses a mathematical model to show how individual social responsibility with regard to immunization (i.e., getting vaccinated) can affect public health, by quantifying the per capita decrease in future infections associated with one vaccination for different immunization times (number of days lapsed since the initial disease outbreak). The methodology is based on a classic mathematical model for generic infectious disease transmission that shows the effects of mass immunization at specific points over a set period of time[13].
Using an indicator (a function of the final values of the model input variables) to plot changes in the rate of infections with and without one additional individual vaccination, we provide an analytical perspective to the decision to vaccinate. The model provides evidence on the relationship between future infectious disease prevalence avoided (the number of individuals that will not present the infectious condition) and the two main model variables (proportion of the population that is vaccinated (p%) and time (t) that the vaccination is carried out (days since initial disease outbreak (d)).
To avoid technicalities and improve understanding, we apply a set of assumptions that simplify the analysis, calculations, and presentation. The main research question is: “What are the population (epidemic) effects of a single inoculation event during the development of an infectious disease, compared to the situation without vaccination?” The more mathematical aspects of the model, which are not necessary for the less technical reader, are provided in the Supplementary Material (see Appendix).
The objective of this article is to introduce the numeric measure—which we call the “individual social responsibility indicator” (iISR)—in order to show, using mathematical tools a priori, the social value of the vaccination process, by quantifying the decrease in the number of future infected persons that will be achieved from the day the vaccine is applied.
Disease and vaccination
We model the effects of vaccination against a generic infectious contagious disease with easy and rapid transmission, caused by a pathogenic agent (virus or bacteria) that over a specific period of time produces immunity (with no chance of reinfection). An example of this type of disease would be some strains of influenza that have been found to spread to a healthy individual from proximity or physical contact with an infected individual through the exhalation and subsequent inhalation of microdroplets[14]. For the purposes of the study, it was assumed that 1) disease transmission was fast enough to obviate the effect of demographic dynamics (births and deaths) and 2) development of the various parameters associated with the transmission and recovery processes was uniform. For example, it was assumed that 1) the probability of disease transmission did not change due to any existing abiotic conditions and 2) the spread and progression of the disease affected all groups (by region, age, and/or gender) equally.
Disease dynamics model
Our disease dynamics model collects data on the transmission and recovery processes but does not consider the details of the disease, population, or specific environment. In other words, we assume that the basic dynamic of the illness is linear and that a person can only be in one of three consecutive stages: 1) healthy but susceptible to the disease; 2) sick from the disease and immediately able to infect others, for a specific period of time; and 3) no longer infectious, with immunity to the disease (i.e., recovered). We also assume that progression from each of these stages to the next one is not reversible. We diagram this sequence as follows:
Susceptible → (α) Infectious → (β) Recovered
In the field of mathematical epidemiology, the above equation is based on the S-I-R model, a very specific application of Kermack–McKendrick theory[15],[16],[17]. In brief, this model is a unidirectional flow of individuals through three consecutive stages (Susceptible (S) → Infectious (I) → Recovered (R)), without feedback. Initially, before disease onset, everyone is in the first stage (S). Then some (those who are infected) move to the second stage (I), for a specific period of time, before moving on to the third stage (R), with no possibility of being re-infected. Progression from one stage to another is not simultaneous for the entire group but is based on the rate of infection, a ratio per unit of time.
Flow (a) (S → I) depicts the disease transmission process. Here, the model assumes individuals do not change their social dynamics due to the presence of disease; therefore, the proportion of close physical contacts that could cause transmission, and the capacity/conditions for an infectious agent to move from one host (at the Infectious stage) to another (at the Susceptible stage) do not change over the Susceptible/Infectious cycle. In other words, each day of the cycle, there is a fixed percentage of Susceptible individuals that each Infectious person is capable of infecting in that 24-hour period. This percentage is denoted as B%, which is multiplied by the number of Susceptible and Infectious individuals to calculate Incidence. Therefore, disease flow (Incidence), is defined as:
B% × n°. Susceptible × Infectious
For the flow from the second to the third stage (Infectious (I) → Recovered (R), we assume that on average a person in the Infectious stage can transmit the underlying pathogenic agent for a specific period of time (T) (number of days since initial disease outbreak (d)). Therefore, each day, a fraction of the Infectious pool (1/T) is removed from the group and moves on to the third stage (Recovered, R). This flow from the second to the third stage—the “daily recovery rate”—is defined as follows:
(1/T) × n°. Infectious
We also assume that all members of a healthy population of N individuals are Susceptible to the disease at the initial contact with a newly infected person (Day 0) (for example, a tourist returning to the country who, through successive transmissions, triggers the development of an infection chain). To simplify the model calculations after the initial transmission (Day 0), we also assume that the given population is closed (for example, due to some internal regulation, and through the use of some early detection mechanism, newly contagious people from outside the population can not infiltrate it and add to the infection rate). Therefore the disease can only propagate from the initial case, during its Infectious stage, in the form of one or more secondary cases. In mathematical epidemiology, the number of newly infected individuals is called the basic reproduction number and is generally denoted by R0[18][19]. Therefore, this part of the model is expressed as:
R0=B%×N×T.
The basic reproduction number represents the daily spread of an infection within N individuals in the Susceptible stage (B% × N) multiplied by the number of days (t) that they remain contagious.
Vaccination dynamics model
To depict the effect of the vaccine on the disease prevalence, we assume that a certain number of days (d) after the initial disease outbreak, a proportion of the Susceptible population (p%) is immunized, one time only, and that the effects of the immunization are instantaneous. This part of the model flow is expressed as follows:
Susceptible → (C) Vaccinated
The proportion of the population that is removed from the Susceptible group, as a result of vaccination, on day “d” since the initial disease outbreak, is equal to:
p%× n° Susceptible
In summary, at the time of the initial disease outbreak (day0), the total population (N) is susceptible to being infected, at which point the first Infectious individual emerges, triggering the transmission process, which generates new Infectious individuals that, in turn, become transmitters of the pathogen over a specific number of days (t). Then, on day “d,” the health agency proceeds to vaccinate the proportion of the population (p%) that has not yet been infected (the Susceptible group). Based on the model parameters described above, the following questions arise:
- How much did the number of people who at some point fell ill decrease at the end of the outbreak?
- How much did each vaccinated person contribute to this decrease?
Results
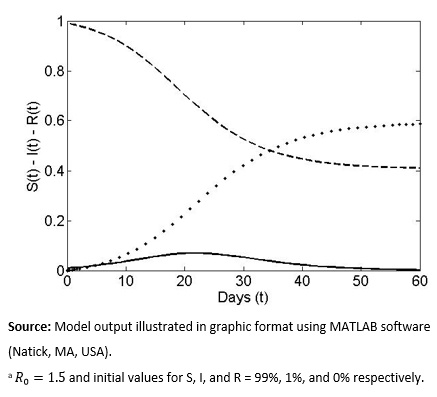
The model flows described in detail in the previous section were programmed computationally using MATLAB software (though numerous other programs could have been used), using specific numeric parameters. We assume that at the beginning of the disease outbreak, on average, two Infectious individuals will lead to three new Infectious cases before healing (R0 = 1.5, a value applied, for example, to the pandemic flu H1N1-2009[20]). We also assume that, initially, 1% of the population is Infectious and the remaining 99% is Susceptible to disease. In Figure 1, the solid line represents the percentage of Infectious individuals in the total population in the absence of a vaccination event. The curve without vaccination is always unimodal (an outbreak) with an asymptotic drop to zero over time (i.e., elimination of the disease from the population), symbolized as ![]() . Based on the model, the maximum number of Infectious persons was 7% and occurred approximately 22 days after the initial disease outbreak. The post-vaccination scenario represented by the curves for the Susceptible group (S) (dashed lines) and the Recovered group (R) (dotted lines) is, respectively, decreased to a final value of
. Based on the model, the maximum number of Infectious persons was 7% and occurred approximately 22 days after the initial disease outbreak. The post-vaccination scenario represented by the curves for the Susceptible group (S) (dashed lines) and the Recovered group (R) (dotted lines) is, respectively, decreased to a final value of ![]() for infection (i.e., not all of them end up infected) and
for infection (i.e., not all of them end up infected) and ![]() for asymptotic growth (total individuals who were infected at some point). The curves for the latter two groups always have a sigmoid and inverse sigmoid shape respectively.
for asymptotic growth (total individuals who were infected at some point). The curves for the latter two groups always have a sigmoid and inverse sigmoid shape respectively.
 Full size
 Time of vaccination
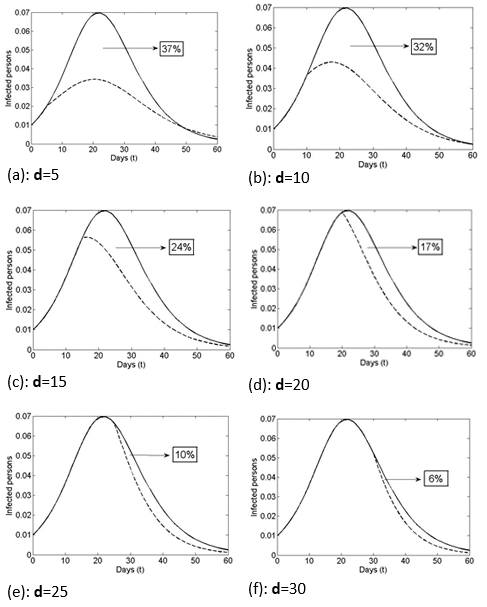
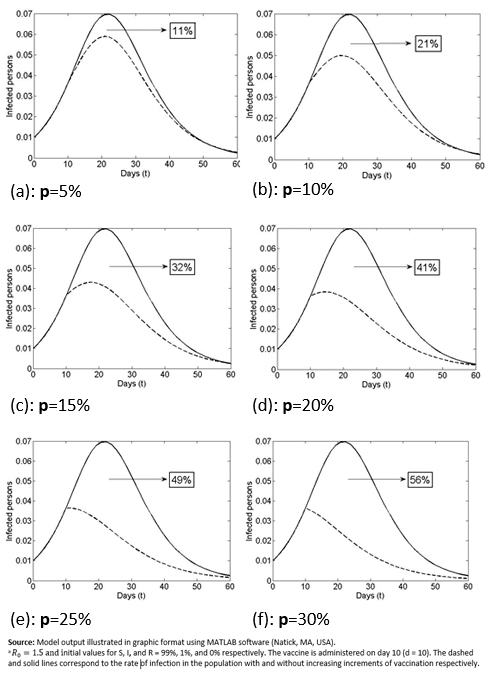
In Figure 2, in the scenario with vaccination, the dashed lines show the reduction in the rate of infection by day of inoculation (Day 0 or initial disease outbreak (vaccination case or VC0) to Day 60 (vaccination 60 days from initial disease outbreak). As shown in Figure 2a-c, getting vaccinated on Days 5, 10, and 15 would reduce the infection rate to approximately 3.3%, 4.2%, and 5.6% respectively, while getting vaccinated 22 days or more post-outbreak (Figures 2d-f) would have no major effect on the maximum total prevalence (i.e., there was no major reduction in the proportion of infected people if vaccination was delayed longer than 22 days after the disease outbreak). As shown, the time that elapses from VC0 (initial disease outbreak) and the day of inoculation has a significant effect on the number of people who ultimately get the disease.
Figure 2 shows the effect on the size of the Infectious group of vaccinating the same percentage of the Susceptible group (15%) but with different amounts of time (days) lapsed since the initial disease outbreak. As shown, earlier vaccination corresponds to a greater decrease in the number of those who are ever infected with the disease. The area under the curve (except for a factor 1/T) shows how many people will be infected at some point in time (total prevalence). Moving across the Figure 2 graphs (a-f) there is a reduction in the areas under the solid curve (”without vaccination”) and the dashed curve (“with vaccination”) (i.e., the vaccine benefit drops as the time since the initial disease outbreak increases).
 Full size
 The individual social responsibility indicator (iISR) represents the final number of infected patients avoided by one vaccination, which is the difference between the final number of infected patients without the additional vaccination ![]() and the final number of infected individuals with the additional vaccination
and the final number of infected individuals with the additional vaccination ![]() , divided by the total number of vaccinated individuals ( ), as shown below:
, divided by the total number of vaccinated individuals ( ), as shown below:
![]()
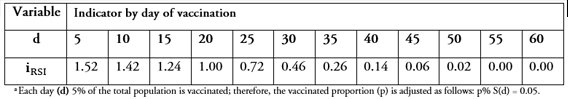
As shown in Table 1 and Figure 3, earlier vaccination leads to a greater reduction in the final number of people infected. For example, vaccination five days after the disease outbreak not only prevents the individual who got inoculated from getting sick but also contributes to a lower rate of infections (about 1.5 times fewer) in the population. However, this effect is reduced over time. For example, a delay in vaccination of 25-30 days from the initial disease outbreak would require three additional individuals getting vaccinated to achieve the same reduction in overall prevalence. From Day 50 onward, almost no infections are avoided by vaccination other than in the individual him/herself.
 Full size
 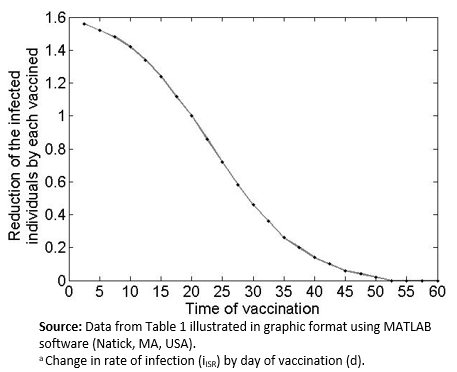 Full size
 Proportion of population (p%) vaccinated
Another interesting question is: What is the behavior of the indicator ( when the day of vaccination is kept constant but the percentage of vaccinated people (p%) is changed? As shown in the graphs of Figure 4. , which compare the proportion of infected population and the day of inoculation, varying the vaccinated proportion for the 10th day from 5% (Figure2a) to 30% (Figure 2f). Increasing this percentage results in a decrease in the infection curve (the perforated line). On the other hand, as shown in Table 2, and the graphs in Figure 5, the reduction in the rate of infected persons resulting from each additional vaccinated person decreases when the proportion of vaccinated persons increases. This seems contradictory but is the result of decreasing the rate of infection by increasing the proportion of Susceptible population vaccinated. However, the smaller the percentage of the population that gets vaccinated, the greater the effect of individual social responsibility (i.e., the greater the effect of one additional vaccination), although the range of the variation (1.32 to 1.45) is narrow, given the parameter values.
 Full size
 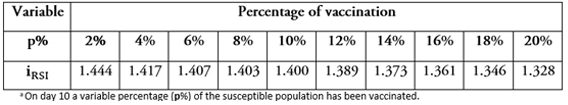 Full size
 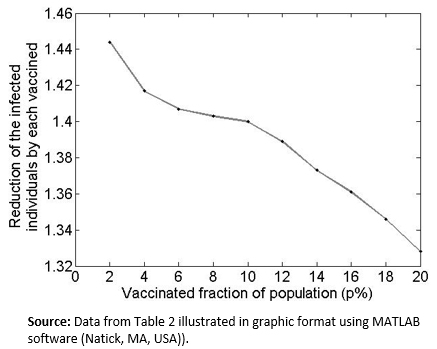 Full size
 Conclusion
Using a very simple mathematical model of 1) the spread of an infectious disease and 2) control of the infection through immunization, this article provides support for and, from an analytical perspective, complements, current efforts to highlight the strategic importance of timely vaccination campaigns in protecting the population from epidemic outbreaks. Using of this model we quantify and illustrate, in graphical format, the consequences of each additional vaccination, showing, for example, how much one individual vaccination can reduce the potential chain of infection and, post-outbreak, how many fewer people suffered from infection as a result of one individual taking this step as part of his/her social responsibility.
As expected, each trajectory determined by the dynamic SIR-type model is altered by a vaccination event (resulting in the immediate removal of a proportion of the Susceptible group), and the final total prevalence (proportion of the population that, at some point, is infected) decreases. However, this reduction in total prevalence decreases if the vaccination is delayed or if the percentage of those inoculated drops (see Appendix).
More precisely, given a particular infectious disease (adjusted to an SIR-type model using constant Infectious and Recovery parameters), use of the indicator helped to illustrate how each additional vaccinated person was associated with a decrease in the number of people who at some point felt ill with the disease. By inserting different times (d) and rates (p%) of vaccination, the indicator helped measure the consequences in terms of how many people did not get sick if one additional person were vaccinated. The results of applying this indicator show that one person not getting vaccinated not only puts him/her at risk but also increases infection in others. In this way, the cost or benefit to society resulting from this individual decision is measured by the indicator.
In summary, to the best of the authors’ knowledge, this research is the first to propose and describe an indicator for measuring individual social responsibility for vaccination. This indicator could be used to support arguments for more timely reactions to disease outbreaks by public health authorities and greater coverage in mass vaccinations.
Notes
From the editor
The authors originally submitted this article in Spanish and subsequently translated it into English.
Author’s contributions
FCL: conceptualization, methodology, formal analysis, research, drafting (revisions and editions), supervision, project administration. JPGJ: methodology, research, data management, data presentation, manuscript preparation (development of the original draft), display. MTMQ: conceptualization, research, drafting (revisions and editions).
Sources of funding
The authors declare that there were no external sources of funding.
Declaration of conflicts of interests
The authors have completed the ICMJE conflict of interest declaration form and declare that they have not received funding for the production of the report; have no financial relations with organizations that might have an interest in the published article in the last three years; and have no other relations or activities that could influence the published article. Forms can be requested by contacting the responsible author or the editorial board of the Journal.
Acknowledgments
We would like to thank the Epidemiological Analysis line of the Doctorate program in Applied Mathematical Modeling, Universidad Católica del Maule, and the research team of the National Fund for Scientific and Technological Development (FONDECYT) Initiation project (#11150784).
Supplementary material
See Appendix at: https://doi.org/10.6084/m9.figshare.7022180
