Notas metodológicas
← vista completaPublicado el 17 de marzo de 2021 | http://doi.org/10.5867/medwave.2021.02.8109
Metodología GRADE, parte 1: cómo evaluar la certeza de la evidencia
The GRADE approach, Part 1: how to assess the certainty of the evidence
Abstract
The certainty of the evidence for interventions is the certainty or confidence that the true effect is within a particular range or relative to a threshold. In the new pyramid of evidence, systematic reviews represent the magnifying glass through which this certainty is evaluated. The GRADE (Grading of Recommendations Assessment, Development and Evaluation) approach arises in response to the existence of multiple evidence classification systems, and it offers a transparent and structured process to develop and present summaries of evidence considering its certainty and, in a second step, the strength of the recommendations that they inform. The GRADE process begins with an explicit question that includes all important and critical outcomes explicitly. The main domains used to assess the certainty of the evidence are risk of bias, inconsistency, indirectness of evidence, imprecision, and publication bias. The factors that can increase the certainty of the evidence are dose-response gradient, large magnitude of an effect, and effect of plausible residual confounding. Finally, the Summary of Findings tables summarize the process in a simplified way and with controlled language. This narrative review’s purpose is to address the GRADE approach’s theoretical and practical underlying concepts in a simplified way and with practical examples.
Main messages
- The GRADE approach establishes unified and transparent criteria to rate the certainty of the evidence and the strength of the recommendations.
- The GRADE methodology's scope includes assessing the certainty of the evidence and the strength of the recommendations on interventions, diagnostic tests, and prognostic models.
- Some of the specificities of GRADE for different types of evidence are in continuous development.
- This work addresses the GRADE methodology's main basic theoretical and practical concepts to assess the certainty of the evidence of interventions in friendly language. It provides examples aimed at the training of undergraduate and graduate students.
Introduction
Background of The GRADE approach
The concept of incorporating "evidence" into clinical practice was coined in Canada by a group of internists and clinical epidemiologists from McMaster University School of Medicine, who consolidated the concept of evidence-based medicine (EBM) given that the progressive and overwhelming increase in scientific publications was not associated with their certainty. EBM is based on pillars (patient preferences, clinical expertise, and the best available evidence) that contributed to the paradigm shift in medical science study and practice. To make the process of evaluating the best available evidence easier, it was necessary first to objectify its "certainty."
The Canadian Task Force formulated the first ranking of the evidence on the Periodic Health Examination in 1979, and five years later, this ranking was adapted by the U.S. Preventive Services Task Force (USPSTF). Another widely accepted ranking was established in 1995 by epidemiologist David L. Sackett. By this time, there are several coexisting classifications of the quality of the evidence, mainly based on the study design. They usually hierarchize "levels" of evidence (e.g., I, IIa, IIb, III). In turn, there are several classifications of the recommendations according to predefined criteria (e.g., grade A, B, C). The main problem with these systems is the lack of interoperability, so that a "level I" or a "grade A" recommendation does not always mean the same for each system [1]. That is why GRADE emerges as a unified definition of the certainty of the evidence that can serve as input for the formulation of recommendations [2].
The certainty of the evidence for interventions is the confidence that the true effect is within a particular range or threshold [3],[4]. This definition has two critical contextual implications:
- Systematic reviews should not make recommendations since, in these, the certainty of the evidence reflects the degree of confidence that an effect estimate is correct.
- Panels that develop recommendations for clinical practice guidelines should make judgments about the certainty of the evidence related to the specific context in which the evidence is being used [3].
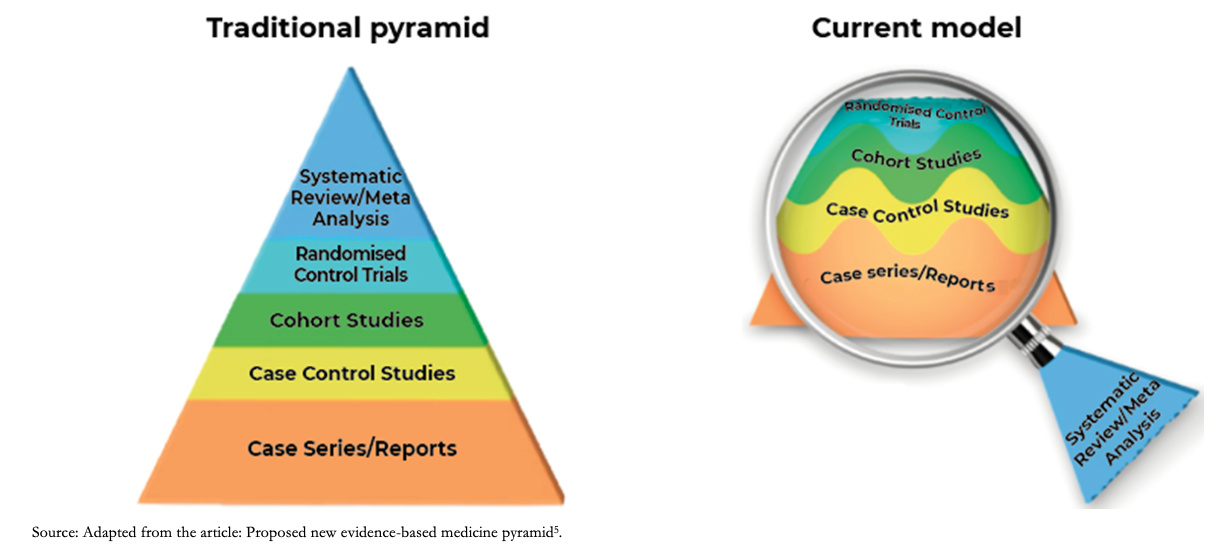
GRADE in the new pyramid of evidence
The level of evidence represented by the old or traditional pyramid of evidence provided a static level of evidence for the different designs, positioning systematic reviews and meta-analysis at the highest level of the pyramid. The current model understands systematic reviews as a magnifying glass through which an analysis of the evidence is viewed and applied, the certainty of the evidence being variable and dynamic for different studies with the same design as shown in Figure 1 [5]. As an example, to answer a therapeutic question, a clinical trial may not always be the best design: If it incorporates few patients with relevant biases, it may generate less reliable estimates than a cohort study with a large number of patients and a robust analysis of its variables. In this example, the magnifying glass that allows us to differentiate the studies in their internal structure would be the systematic review.
 Full size
 Accordingly, the GRADE approach emerges as a framework to assess the certainty of evidence and to formulate recommendations. Therefore, for a given clinical therapeutic question, an observational study could eventually provide greater certainty of evidence than a randomized clinical trial, or vice versa. It should be considered that observational studies usually fall below clinical trials due to intrinsic weaknesses in their design (e.g., they do not usually establish strong causality). It is also important to clarify that this approach does not eliminate the inevitable need for judgments with a certain degree of subjectivity but provides a framework for systematization and transparency [6].
This article is the third of a methodological series of narrative reviews on general topics in biostatistics and clinical epidemiology, exploring and summarizing in a friendly language, published articles contained in the primary databases and specialized bibliography. The series is aimed at the training of undergraduate and graduate students. It is carried out by the Chair of Evidence-Based Medicine of the School of Medicine of the Universidad de Valparaíso, Chile, in collaboration with the Research Department of the Instituto Universitario del Hospital Italiano de Buenos Aires, Argentina, and the UC Evidence Center, at the Universidad Católica, Chile. This article aims to address the main basic theoretical and practical concepts of the GRADE methodology for assessing the certainty of the evidence for interventions.
The GRADE Approach
What is the GRADE methodology, and what is its scope?
This initiative arose as a response to the existence of multiple evidence classification systems (e.g., CTFPHC [7], USPSTF [8], CEBM, AHA / ACC [9], and more). Based on a comprehensive analysis of all current recommendation systems, the GRADE methodology (Grading of Recommendations Assessment, Development and Evaluation) offers a transparent and structured process to develop and present summaries of evidence, including its certainty, for preparation of Summary of Findings tables in systematic reviews and make recommendations in medical care [6]. The scope of the GRADE methodology includes the assessment of the certainty of the evidence and the strength of the recommendations on interventions, diagnostic tests, and prognostic models. Some of the specificities of GRADE for different types of evidence are in continuous development.
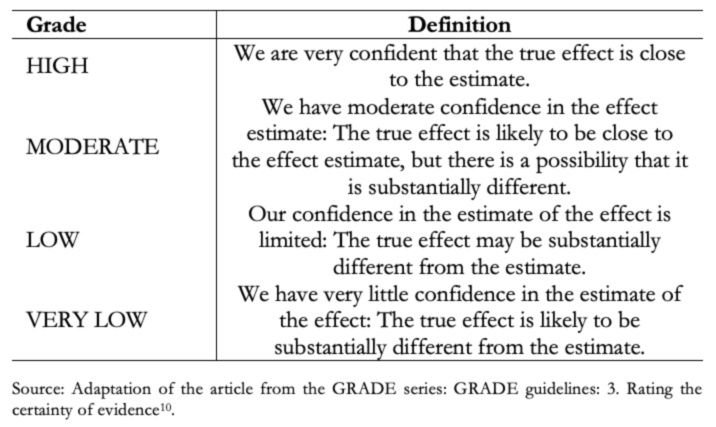
What do the categories awarded by GRADE mean?
Before evaluating the different steps of the process proposed by GRADE, it is convenient to know what each grade of certainty of evidence means [10].
 Full size
 Steps proposed by GRADE to assess the certainty of the evidence
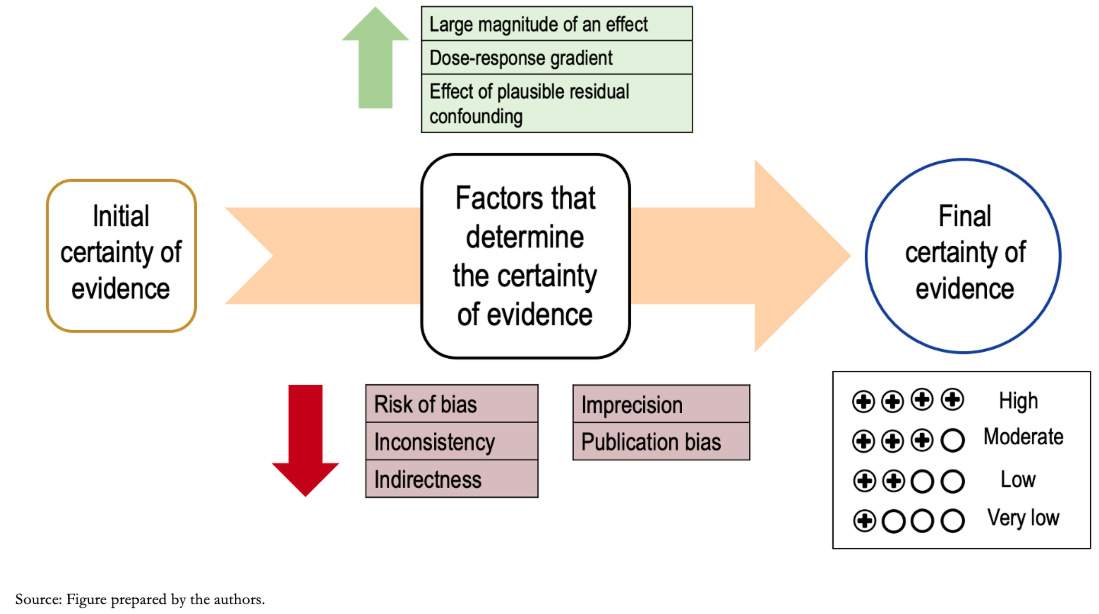
The GRADE process begins with an explicit question, including the specifications of all important and critical outcomes (a topic covered in an upcoming installment in this series). Based on this question and according to the methodological design used, an initial certainty is defined, which is then analyzed according to different domains, modifying the certainty of the evidence to, ultimately, reach a "final certainty." Figure 2 shows a summary of the different steps of the GRADE methodology.
 Full size
 As anticipated, the study design's initial level of evidence varies according to different factors or domains that influence it. These may lower the certainty of the evidence or increase it [10]. Generally, results derived from clinical trials start with a high level of initial evidence certainty and those derived from observational studies with a low level of certainty, although exceptionally, this may vary.
Among the domains that lower the certainty, there are:
- Risk of bias.
- Inconsistency.
- Indirectness.
- Imprecision
- Publication bias.
These are registered with values (-1) or (-2) depending on whether the result of the domain analysis is considered "Serious" or "Very serious," respectively.
The factors that may increase the certainty of the evidence are:
- Dose-response gradient.
- Large effect size.
- Effect of plausible residual confounding.
These are also recorded as numbers (+1) or (+2) depending on their impact on the overall certainty.
A. Domains that lower the level of evidence
1) Risk of bias: Both randomized controlled trials (RCTs) and observational studies may incur an additional risk of misleading results if they have flaws in their design or conduct, which other publications call "validity" or "internal validity problems," and we call "study limitations" or "risk of bias" [11]. The risk of bias can indicate a systematic deviation from the truth, reducing the certainty of the results, and, in a meta-analysis, it is more prudent to trust the one with the lowest risk of bias. It should be noted that risk of bias is not the same as bias, the latter being the systematic error, and the risk of bias the subjective assessment of the probability of this error. There are numerous tools to assess the risk of bias in randomized trials and observational studies (for example, the tools developed by Cochrane: RoB 2 and ROBINS-I respectively) [11],[12].
Examples 1a and 1b. Levels of risk of bias
2) Inconsistency (Heterogeneity): Inconsistency refers to the variation of the effect estimates (including the confidence interval), having excluded the leading causes of this variation [16]. For example, the effect of a pharmaceutical intervention may vary from one study to another due to the variability of the PICO question elements (patients, intervention, comparison, or outcome) in each of the studies. However, if this variability does not justify the differences in the estimate of the effect, the certainty of the evidence decreases.
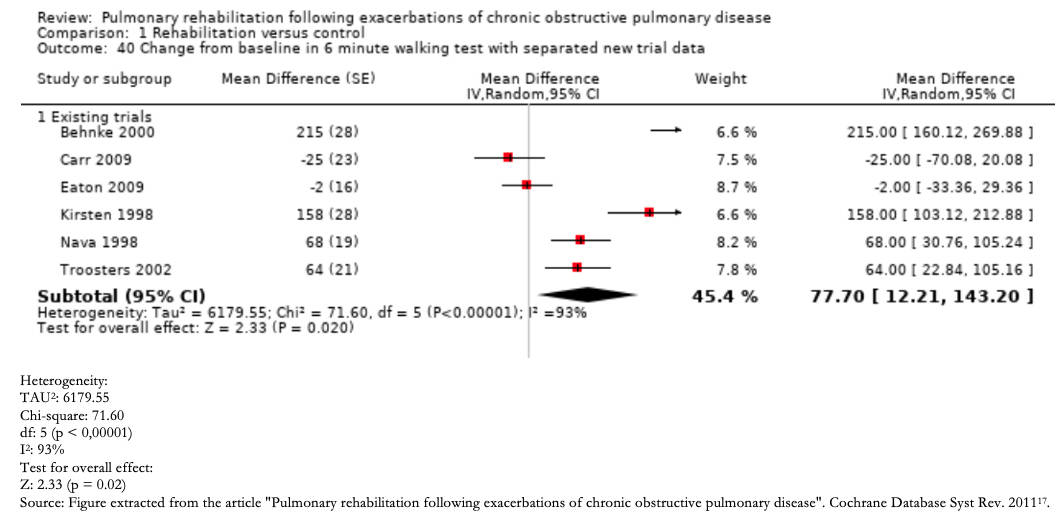
Any inconsistency in the effect estimates can be assessed by the degree of overlap between study results should initially be assessed. If there is an overlap between the confidence intervals of each primary study's estimates, the effects may be deemed consistent, and conversely, if there is little overlap, these findings are inconsistent. Inconsistency is easier to understand through the visual inspection of a Forest plot (Example 2).
Furthermore, it is possible to resort to statistical tests, such as the heterogeneity test, in which a low p-value indicates inconsistency, and the I2statistic, which quantifies the proportion of variation in the point estimates due to differences between studies: the higher I2, the greater the inconsistency (< 40% is considered low, 30 to 60% moderate, 50 to 90% substantial, and 75 to 100% significant) [16].
It is important to clarify that this domain is not related to the distribution of effects regarding the line of no effect.
 Full size
 3) Indirectness: Indirectness refers to the emerging problems in the concordance between the elements of the PICO question of the evidence and the PICO question of the systematic review or guideline that uses such evidence. The evidence may be indirect for the study question when there are differences in patients, interventions, comparisons, or outcomes [18]. This means that the study does not directly answer the result raised in the clinical question, but instead, the study uses a different result (for instance, a surrogate outcome), but that could indirectly provide information on the outcome of interest (See Example 3).
A systematic review evaluates the effect of alendronate in preventing pathological fractures at 10 years in women with osteoporosis. Suppose the primary outcome of an included study is an improvement in bone densitometry rather than radiographic alterations characteristic of fractures. In that case, it does not directly measure the effect on the presence or absence of fractures but an intermediate (surrogate) result that predicts the incidence of fractures (indirect outcome). Conversely, if a healthcare professional discusses the treatment options for osteoporosis with an 88-year-old woman considering the evidence from clinical trials in which the mean age was 61, he may consider that he is extrapolating the results (indirect population). In both cases, assuming they are randomized clinical trials, they would go from a high level of certainty to, possibly, a moderate level of certainty.
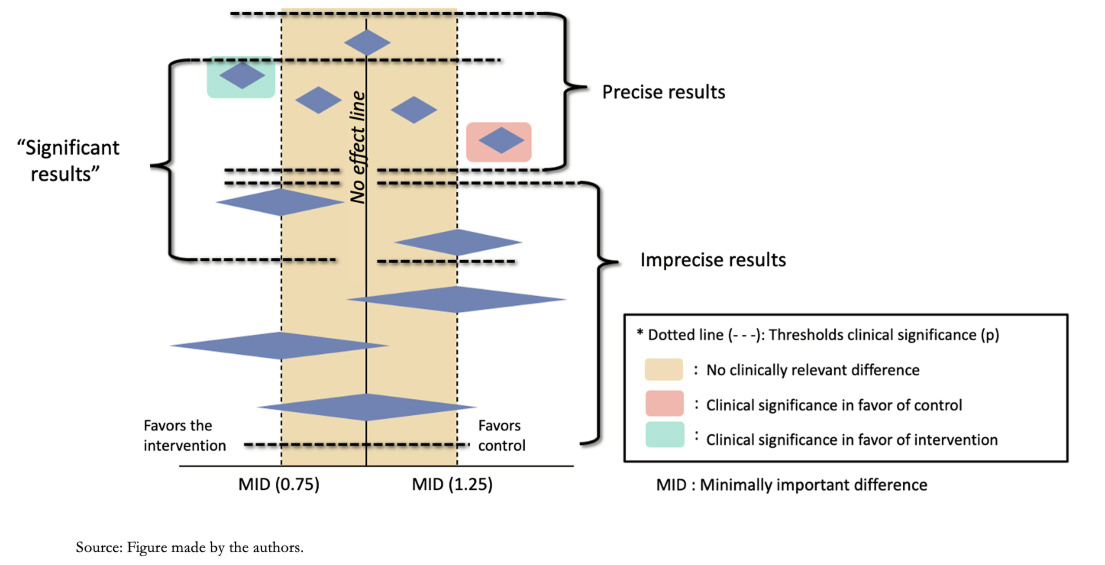
4) Imprecision: Results are imprecise when studies include relatively few patients and few events; consequently, they have wide confidence intervals around the effect, which does not allow a clear estimate of its magnitude [19].
Precision can be evaluated in two ways:
A) examining the extremes of the confidence interval of the effect estimate in relation to a threshold.
b) evaluating the amount of available data in relation to an optimal information size.
When using the first approach, it is necessary to define what threshold is used to estimate that an effect is clinically relevant and its magnitude (small or substantial). Usually, the minimally important difference can be taken as a reference, for example, for continuous outcomes (Figure 4). For the second approach, it is necessary to calculate a clinical trial's sample size with adequate power for the outcome being evaluated. If the confidence interval crosses the established threshold or the amount of data does not reach the optimal information size, the certainty of the evidence is downgraded.
Graphically, what should be analyzed is the confidence interval of the meta-analysis (not of each individual study) represented by the diamond figure in the Forest plot shown as an example in Figure 4.
 Full size
 The minimally important difference (MID) corresponds to the smallest difference in score in the outcome of interest that patients consider important, indicating a change in treatment [11]. This concept, which will be explored in a future article in the series, relates the magnitude of the change to treatment decisions in clinical practice, emphasizing that the patient's perception prevails over statistical significance. This concept applies to outcomes with continuous values such as those that use scales (for example, the visual analog scale to determine pain intensity), while in a dichotomous outcome (such as mortality), the effect estimate is through relative risks, odds ratio, or hazard ratio. There are no pre-established thresholds for dichotomous outcomes as the minimally important difference; however, the relative risks of 0.75 and 1.25 are taken as a rule of thumb to assess the precision of the results. These relative threshold values translate into absolute risk differences, which are the most important for decision-making. For example, a relative risk of 0.75 could imply a reduction in the absolute risk of mortality from 40% to 30% (10% difference in mortality). If the event is rarer, a relative risk of 0.75 may be less relevant. For example, it could imply a reduction in cancer-specific mortality from 4 per 1000 to 3 per 1000 (an absolute difference of 1 per 1000).
Examples 4a and 4b. Continuous value precision and dichotomous outcome.
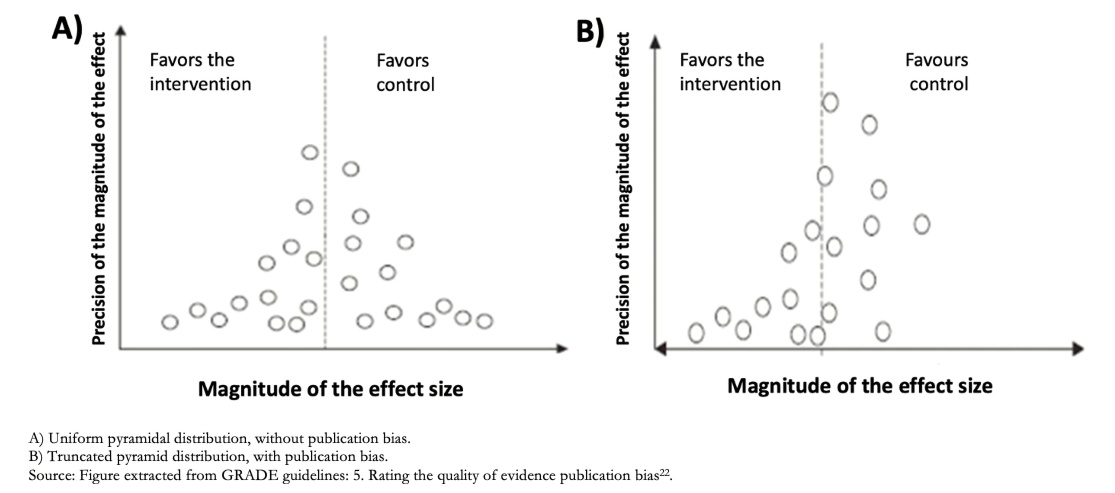
5) Publication bias: It is possible that there are studies whose results contradict the results of the meta-analysis and that these have not been included, either because they were not published or because they are in non-indexed journals [22]. These studies typically have "negative" results (i.e., they do not show a significant effect in favor of the intervention). This phenomenon is denominated publication bias. However, this form of bias is hard to detect; therefore, it is difficult to lower the certainty of the evidence for this cause confidently and, if there is sufficient evidence of this bias, the evidence is usually downgraded one level (-1).
Publication bias is usually assessed using a graph called Funnel Plot [Figure 5], representing how the studies are distributed around the study's real effect; when it is funnel-shaped, there would be no bias. If this bias exists, we will see a space between the studies giving this image of a truncated pyramid, as in Figure 5, with missing studies that contradict the intervention's central estimate.
 Full size
 B. Factors that can increase the certainty of the evidence
Although the main role is taken by the factors that lower the level of certainty, it is important to know that factors can increase it. However, two conditions are required: that the study is observational and does not present any of the limitations (biases) previously mentioned. There are three reasons to increase the level of certainty by one point:
1) Large magnitude of effect: If the body of evidence gives large or very large estimates of the magnitude of an intervention's effect, it is possible to be more confident about the results. On such occasions, although observational studies are more likely to overestimate the true effect, the study design that is more prone to bias is unlikely to account for the full apparent benefit or risk. A meta-analysis of observational studies showed that bicycle helmets reduce head injury risk in cyclists by a wide margin (odds ratio 0.31, 95% CI 0.26 to 0, 37). In the absence of obvious bias that the association might create, this large effect suggests a moderate rather than low certainty evidence rating [23].
2) Dose-response gradient: The existence of a dose-response effect also increases the level of certainty. For example, there is a dose-response gradient between higher INR levels (an indicator of the degree of anticoagulation) and the increased risk of bleeding in anticoagulant users. This finding would increase our certainty as to which supra-therapeutic anticoagulation levels might increase the risk of bleeding [15].
3) Effect of potential residual confounding factors: When assessing the evidence, the possibility that there are unmeasured confounding factors that reduce or increase a given effect may be considered. When the result obtained is not affected by these factors, it is possible to increase the certainty by one level. For example, if an analysis considers that people who use condoms are likely to have more sexual partners, it would be expected that the risk of HIV infection is higher in this population. However, this factor did not reduce the demonstrated effect of the condom, making it such an effective measure for the prevention of HIV transmission that it outperforms this unmeasured confounding factor [24].
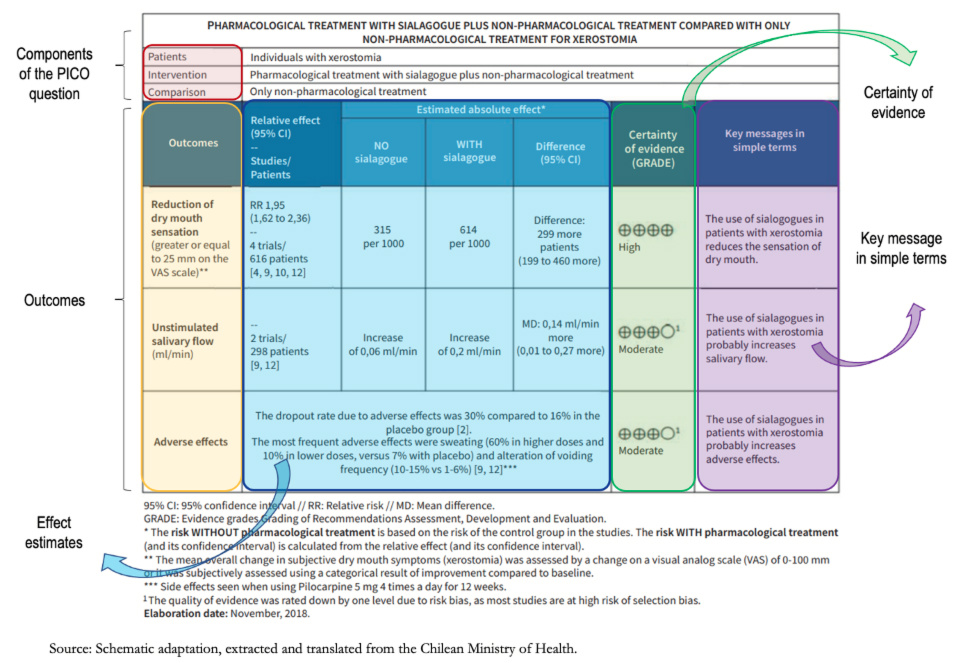
Summary of Findings Tables (SoF)
All this process proposed by GRADE is summarized quite simply in the Summary of Findings tables or SoF tables for their acronym.
These tables show the entire process for rating the certainty of the evidence for each outcome, with their relative and absolute effect, the certainty of evidence (with its justification), and the key message in a controlled language.
 Full size
 Clarifications:
Regarding the certainty of the evidence, this is high, as expressed in the table by means of "+" figures (+ very low; ++ low; +++ moderate; and ++++ high). In the second and third outcomes (unstimulated salivary flow and adverse effects), the certainty is moderate. A superscript (1) explains the reasons for this certainty referenced in the footnotes of the table. In this case, the risk of bias was argued, given that the majority of the studies presented selection bias, decreasing the certainty by one level.
Controlled language
Once the certainty of evidence has been obtained, it must be communicated through a controlled language, transmitting in simple words the entire process previously carried out. In the SoF table, it is specified in the box on the right titled "Key message in simple terms," where phrases such as "probably increases salivary flow/adverse effects" reflect moderate certainty; and statements such as "reduces the feeling of dry mouth" reflect high certainty.
Conclusions
Currently, the GRADE approach is one of the main methods used internationally in developing clinical guidelines and recommendations since it provides a clear and transparent framework for assessing and presenting the certainty of the evidence. Although the GRADE working group addresses each of the concepts thoroughly in its extensive series on this methodology, at first, its understanding and application can be overwhelming for beginners. Through simple descriptions and examples of the GRADE methodology's fundamental elements, this article seeks to provide a simplified and summarized approach for its understanding and application by the general public, students, and new methodologists.
