Methodological notes
← vista completaPublished on July 15, 2021 | http://doi.org/10.5867/medwave.2021.06.8315
Introduction to network meta-analysis for evidence synthesis
Introducción a los metanálisis en red para la síntesis de evidencia
Abstract
This article belongs to a collaborative methodological series of narrative reviews about biostatistics and clinical epidemiology. The goal is to present basics concepts concerning the systematics reviews of multiple treatments comparisons with network meta-analysis. For clinical ques-tions with several therapeutic alternatives to be compared, the central question is how to classify or rank their effectiveness (benefit and harm) to choose the best option. The network meta-analysis aims to answer questions related to the effectiveness and safety of comparing multiple treatments by the simultaneous analysis of results raised from direct and indirect comparisons. The network geometry is the general graphical representation of the network meta-analysis and allows to understand and assess the strength of comparisons. The network meta-analysis should check several assumptions to be valid, especially the transitivity assumption, which allows assuming that there are no systematic differences among the included comparisons, except their compared interventions. Thus, it is possible to know the relative therapeutic effectiveness of each pair of interventions included in the network meta-analysis and their ranking in terms of categorization. It has been proposed to use a modified Grading of Recommendation, Assessment, Development, and Evaluation (GRADE) approach considering the distinctive features of network meta-analysis to assess the certainty of the evidence for each comparison and the ranking of interventions.
Main messages
- Systematic reviews have long been considered the highest level in the hierarchy of evidence because explicit and clear methodologies increase confidence for their use in clinical practice.
- Network meta-analyses are a particular statistical procedure for systematic reviews, as they simultaneously analyze multiple interventions from direct and indirect evidence.
- This article synthesizes the narrative reviews available in the main databases and specialized reference texts, referring to network meta-analysis in a friendly language, oriented to undergraduate and graduate students.
Introduction
With the rapid increase in the number of studies and reports, different methodological designs have emerged to synthesize and analyze this information. This is the case of systematic reviews, which have long been considered the highest level in the hierarchy of evidence. The use of explicit and clear methodologies in their elaboration and analysis of systematic reviews have increased confidence in them for decision-making in small and large scale clinical practice. It has recently been proposed that systematic reviews can be viewed as the lens through which existing evidence is viewed and applied, rather than a level of evidence per se, due to their methodological characteristics [1].
For clinical questions in which there are many competing (or comparing) regimens or therapeutic alternatives, the central question is how to classify or rank their effect (e.g., benefit and harm) to choose the best option [2]. From a decision-maker point of view, it can be challenging to assess the relative benefits of each treatment versus other available options. This is relevant when a randomized clinical trial has not directly compared multiple therapeutic alternatives. Moreover, the best option in therapeutic terms is not always accessible or applicable, so knowing the second or third best option can be useful. In this sense, it is of particular interest to rank the multiple therapeutic alternatives.
In response to this concern, network meta-analysis was proposed in 2002 as a statistical procedure for evidence synthesis capable of comparing different therapeutic alternatives through direct and indirect comparisons [3]. Previously, some generalities regarding network meta-analysis and its methodology have already been reviewed [4],[5],[6],[7]. However, though time and the dissemination of analysis techniques added to the network meta-analyses advantages – i.e., their ability to synthesize mixed evidence (arising from direct and indirect evidence) – there has been an increased number of publications using this method. This generates a greater weighting of these meta-analyses when it comes to informing health care decisions. In fact, by performing a quick search in the PubMed database of papers indexed under the MeSH term "Network Meta-Analysis" it is possible to see an increase in publications of more than 15 times between 2010 (155 papers) and 2021 (2583 papers). There are also initiatives such as Cochrane Training, where the fundamentals and necessary tools to perform a network meta-analysis are taught. However, before questions related to the execution, it is necessary to bring clinicians closer to this methodology, discuss some important concepts for understanding network meta-analyses, and comment on their contribution to the certainty of the evidence on a given clinical question.
This the tenth article in a methodological series of narrative reviews on general biostatistics and clinical epidemiology topics, which explore and summarize in a friendly language published articles available in the main databases and specialized reference texts. The series is oriented to the training of undergraduate and graduate students. It is carried out by the Chair of Evidence-Based Medicine of the School of Medicine of the University of Valparaíso, Chile, in collaboration with the University Institute of the Italian Hospital of Buenos Aires, Argentina, and the Evidence Centre UC, of the Catholic University of Chile.
This manuscript aims to present basic concepts about network meta-analyses, their methodological assumptions, their particularities for interpreting analyses and results, and their advantages for evidence synthesis and informed decision-making in health.
What are network meta-analyses?
Network meta-analyses correspond to a statistical procedure for systematic reviews, capable of answering clinical questions related to the effectiveness or safety of multiple existing treatments for a given condition. They extend the scope of a common systematic review by simultaneously analyzing evidence from both direct comparisons (from randomized clinical trials) and indirect comparisons (based on a common comparator, which will be explained in more detail later in "network geometry"), to compare multiple treatments with each other [3]. Thanks to this, network meta-analyses can provide information on comparisons that have not been previously evaluated in a clinical trial [8]. Other terms to refer to this type of meta-analysis are multiple treatment meta-analysis or mixed treatment comparisons meta-analysis [3]. From now on, whenever we talk about network meta-analyses, we are referring to systematic reviews of multiple interventions with network meta-analyses.
Unlike standard single-comparison (or pairwise) meta-analyses, network meta-analyses evaluate different interventions for a given condition in the same analysis [9]. This makes it possible to establish the relative hierarchy estimate about the studied outcome. The latter makes it a promising tool for assessing the relative effectiveness compared between different interventions and, in a sense, a necessary method for synthesizing the growing amount of information available to clinicians for decision-making [3],[10].
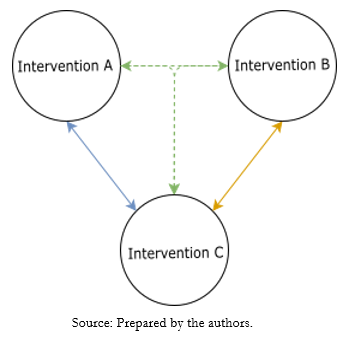
As mentioned above, the final product of network meta-analyses can result from direct or indirect comparisons, depending on the availability of randomized clinical trials for the same clinical question comparing the same interventions (i.e., direct comparison), or from clinical trials with divergent comparisons with at least one intervention in common (i.e., indirect comparison) [11]. Thus, direct evidence is obtained from randomized clinical trials that compare two interventions to estimate the relative effectiveness for a given condition. Meanwhile, indirect evidence is obtained by comparing two interventions and a common comparator that allows them to be related. For example, suppose we have a trial comparing intervention A with intervention C and another clinical trial evaluating the effectiveness of intervention B with intervention C. In that case, it is possible to indirectly compare intervention A versus B through network meta-analysis using a transitive comparator, in this case, intervention C (Figure 1). The combination of direct and indirect evidence has been defined as mixed evidence [12]. Some particularities of mixed evidence and its analysis will be discussed in more detail below.
 Full size
 Network geometry
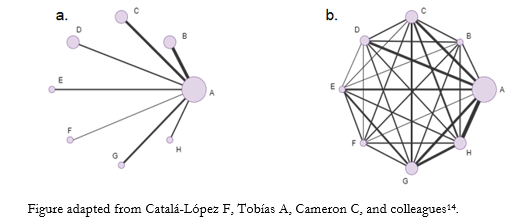
A unique tool of network meta-analyses is the network diagram, which plots the compared interventions. Network geometry is the graphical representation of network meta-analyses that visually display the interventions, directly and indirectly, compared [3]. In addition, it allows approximating the number of studies included for each intervention and the number of participants for each comparison [13]. The network geometry facilitates the understanding of the network meta-analysis and its effect estimators, while a color code can explain the certainty of the evidence for each comparison [13].
In these figures, each network node (treatment nodes) represents a different intervention. Their size indicates the number of patients randomized to that intervention proportionally. The connecting lines between nodes represent direct comparisons rescued from randomized clinical trials. Conversely, when there are no connecting lines between two nodes, no clinical trials comparing the two interventions were identified. Similarly, the width of the lines is proportional to the number of studies included for each pair of interventions [12].
To exemplify network geometries [9], Figure 2a shows a "star network", where the interventions to be compared (B-C-D-E-F-G-H) do not join, showing the lack of direct evidence linking them. However, all the interventions are linked to a single common comparator (A), which allows us to estimate a measure of effect without direct comparisons. Concretely, node A could represent placebo and the other nodes as active interventions. Figure 2b shows a "well-connected network", where each node is linked to the other interventions forming a highly interconnected and complex network geometry. This translates the existence of direct evidence for each linked intervention comparison [9].
 Full size
 Methodological assumptions for the mixed evidence synthesis
1. Homogeneity assumption
First, as in systematic reviews with single-comparison meta-analyses, it is necessary to assess both clinical and methodological heterogeneity [12]. This is because the inputs needed to perform the meta-analysis comes from different primary studies whose results may be affected by other variables and not only by the interventions studied. Indeed, it is possible to assess the heterogeneity of the different direct network comparisons using the same methods used in paired (or standard) meta-analyses [8]. However, a fundamental assumption for the validity of network meta-analyses is that there are no other differences between the included clinical trials besides the interventions to be compared [9].
There are modifying effects that oppose this first assumption and may alter the effects reported in network meta-analyses [11]:
- Effect modification due to within-study heterogeneity: at this point, randomization plays an important role. This allows uniform distribution of the differences between the groups of patients studied in a clinical trial so that the only possible difference between the groups is to be analyzed are the interventions to be compared. When a primary study reports different therapeutic effects of an intervention in different subgroups of patients, other differences besides the interventions to be compared could potentially influence its effect [11]. This may also alter the effects reported in network meta-analysis.
- Effect modification due to between-study heterogeneity occurs when there are systematic differences between the studies included in the network meta-analysis. Concerning the distribution of patients, any patient enrolled in one of the clinical trials analyzed in the network should be hypothetically assigned to one intervention or another [11].
2. Transitivity assumption
In network meta-analyses, there is also another source of variability other than heterogeneity due to the inclusion of studies evaluating different interventions [3].
In this sense, a critical assumption for the validity of network meta-analyses is the transitivity assumption, which assumes that there are no systematic differences between the included studies, except for the interventions [13].
As seen in Figure 1, this assumption gives rise to the comparison of intervention A versus intervention B, using intervention C as a transitive comparator. To assess this, network geometry nodes must be well defined. An important point to consider is that the transitivity assumption is violated when intervention C differs systematically across comparisons. This may occur when in the different comparisons or clinical trials, the transitive comparator is used at different doses, by different routes of administration, at different frequencies, or at different degrees of severity of the condition studied, among others [13]. It is important to note that the assessment of transitivity is not statistical but qualitative in nature [13].
3. Consistency assumption
Another assumption for the analysis of mixed information is consistency, which is the degree of agreement between the information obtained from direct and indirect comparisons [13]. If only indirect evidence is available for comparison, the consistency assumption is reduced only to the evaluation of the transitivity assumption. For this reason, consistency has been considered an extension of the transitivity assumption [13].
Consistency can be evaluated statistically. It is a requirement to calculate this to obtain a valid mixed estimator for each of the interventions compared in the network meta-analysis [13].
If an inconsistency is identified, it is prudent to check for errors in data extraction. The possible modifying effects in the studies in which inconsistency is present should then be examined in more detail [12]. If the inconsistency is substantial and its source is not identifiable, synthesizing the information by network meta-analysis is discouraged [12].
Particularities of indirect and mixed evidence analysis
A novel point in the analysis of evidence performed in network meta-analyses is the synthesis of indirect evidence. When this is related to direct evidence, it allows a single effect estimator to be obtained for a given pair of interventions. This is called "combined or mixed estimation" [10]. For this to be possible, any network meta-analysis must evaluate and meet the assumptions that have been previously reviewed. However, the main requirement for the statistical analysis of network meta-analyses is that the interventions included in the analysis relate to each other by forming a connected network [8].
In the case of a network with three interventions A, B, and C, which does not include a trial comparing A versus B, the results of A versus C and B versus C subgroups are analyzed, followed by an effect estimate for each pair of interventions. Finally, they are statistically compared. As a result, the estimated effect coefficient for A versus B summarizes all the available indirect evidence related to these interventions [8]; in this case: A versus C and B versus C. Thus, in a network meta-analysis with more interventions, the estimated effect coefficient is obtained from the relationship with each other interventions in the network. These other interventions provide information on one of the interventions included in the network from a common comparator.
If there are no direct comparisons for a given pair of interventions, we deal with a network that provides only indirect evidence. However, we speak of mixed evidence if there are both direct and indirect comparisons for the same pair of interventions [15].
The analysis of mixed evidence in network meta-analyses is carried out using complex statistical techniques of meta-regression [16]. These techniques provide effect estimates in terms of probabilities for each of the interventions included in the meta-analysis.
Presentation of results in network meta-analyses
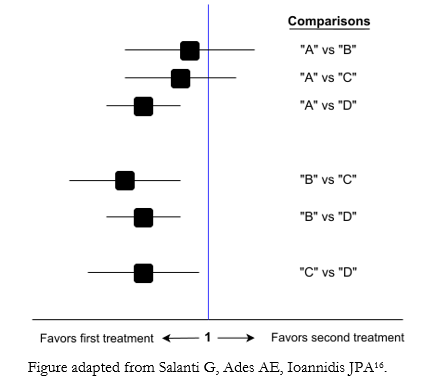
Through the comparisons made by network meta-analyses, it is possible to obtain the relative therapeutic effectiveness between any pair of interventions in the network. The presentation of the results of mixed evidence analysis is generally through tables or matrices that order all the obtained information (direct, indirect, or mixed evidence) [12], with their respective effect estimators (usually in odds ratio or relative risk) and uncertainty [13]. The results of each pair of comparisons can be presented using Forest plot graphs (Figure 3) that summarize the effect estimators and their confidence intervals.
 Full size
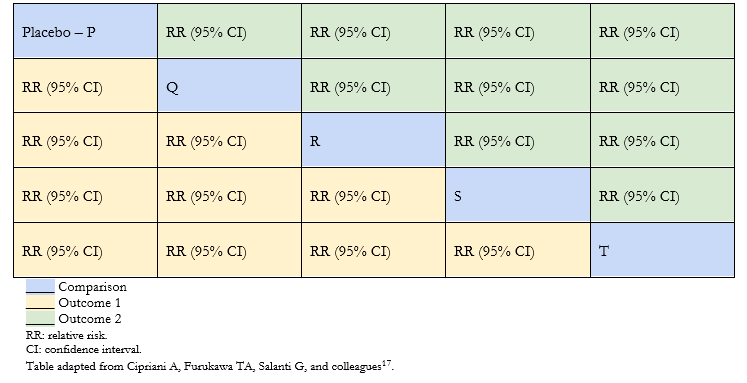
 Because the interventions analyzed with each other are often plenty, the arrangement of the results in tables facilitates the interpretation of the network meta-analysis. Using league tables, information can be extracted from all possible comparisons between the interventions in the meta-analysis. Table 1 shows an example of a league table, where each green or yellow cell corresponds to the effect estimator of the comparison between two interventions according to an outcome. Thus, the first column shows the effect estimators of all interventions (Q, R, S and T) compared with placebo.
This table type makes it possible to show all the effect estimators between the different pairs of interventions for a maximum of two outcomes (outcomes 1 and 2 in Table 1) [12],[16],[17].
 Full size
 In most cases, clinical decision-making is based on a probability analysis. Network meta-analyses provide many estimated effects, which can complicate the decision to prefer one or another of the interventions included in the network. For this reason, network meta-analyses results must be provided in an organized and hierarchical manner [16]. This facilitates identifying the best therapeutic option among the compared interventions through a graphic and ordinal arrangement of the interventions evaluated with their effectiveness.
In this sense, meta-analyses provide a hierarchical ranking of the interventions evaluated in terms of probability. This means that it is a categorization of probabilities; therefore, it is reported in terms of the probability for each number order and each intervention. This ranking of probabilities is usually reported are “rankograms”, surface under the cumulative ranking curves (SUCRA) and probability tables. However, this information is not always presented in network meta-analysis [18].
Rankograms
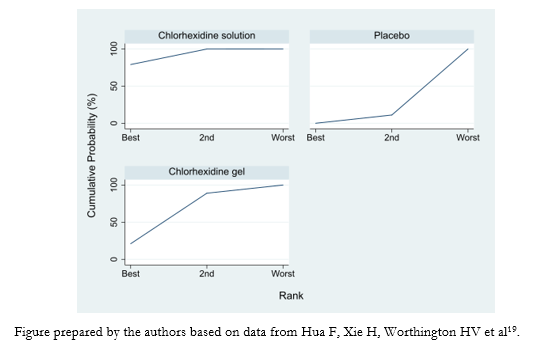
Rankograms are graphs that show the probability that each treatment has of achieving a given ranking. On the X-axis, they show the possible rankings (1, 2, 3, among others) and on the Y-axis, the probability that each treatment has of achieving it [16]. For example, we present the results in the form of a rankogram of a network meta-analysis of three interventions comparing different oral hygiene options in mechanically ventilated patients to prevent ventilator-associated pneumonia (Figure 4) [19].
 Full size
 Surface value under the cumulative ranking curves
From rankograms, it is possible to obtain the surface under the cumulative ranking curves value. This value summarizes the cumulative probabilities of each treatment to reach a given ranking number. It is obtained by calculating the area under the cumulative ranking curve. By integrating all the probable rankings for treatment, the surface under the cumulative ranking curves value allows us to approximate the notion of which treatment has the highest probability of being the best (surface under the cumulative ranking curves values close to 1). Similarly, surface under the cumulative ranking curves values close to 0 aims to interventions that would be the least effective [12],[16],[20].
Probability tables
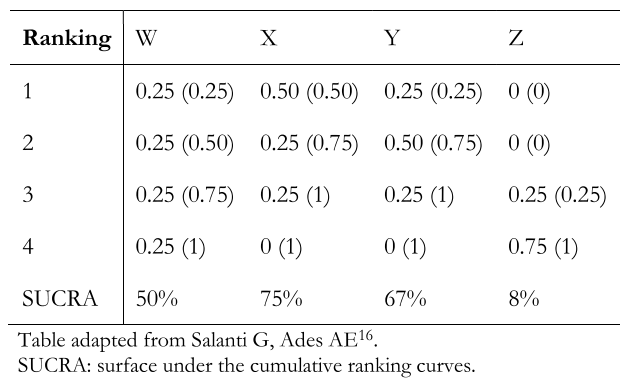
The layout of the probability ranking results in probability table format can be difficult to read. Therefore, the graphical presentations already explained [16] are preferred. The probability tables contain—in each column—the interventions included in the network meta-analysis (e.g., W, X, Y, and Z) and—in each row—the probability of achieving one or another ranking order number (e.g., 1, 2, 3, 4). Thus, in Table 2, the probability that intervention X is the second-best option among the interventions compared is 0.25. These tables can also show in parentheses the cumulative probability of each intervention. Following the example above, the cumulative probability that X is between rank 1 and 2 is 0.75 (75%). Finally, these tables include the surface value under the cumulative ranking curves for each intervention.
 Full size
 How to assess the certainty of evidence in systematic reviews of multiple treatments with network meta-analysis?
The Grading of Recommendation, Assessment, Development, and Evaluation (GRADE) approach is a widely used system to determine the degree of certainty of evidence in systematic reviews by analyzing five components. There is an article in this methodological series that deals with this subject in depth for more details [21].
To assess the degree of certainty of the evidence of network meta-analyses, it has been proposed to use the GRADE model with some modifications [15],[22] derived from the use of indirect evidence, the differential contribution of the different sources of direct evidence to the final effect, the assumption of transitivity for the assessment of mixed evidence, and the possibility of inconsistency between direct and indirect evidence.
The ranking of treatments estimate is done from the entire evidence network, while the effect size estimate between paired comparisons is done by incorporating results from direct and indirect sources. In this case, direct evidence weighs most heavily on the final estimated effect [15]. Due to the nature of the results offered by network meta-analyses, it has been proposed to evaluate the certainty of the evidence for the findings related to the effect size between each network comparison and for the ranking of treatments.
Although it is possible to analyze the five GRADE domains [15] for each effect estimator, this can be inconvenient when assessing each paired comparison present in a network meta-analysis. This is also true for assessing certainty in ranking, guided by the domains of the GRADE tool. In addition, there is a certain degree of subjectivity, for example, in the assessment of imprecision, which is based on the observation of rankograms.
Nevertheless, there are proposals based on the GRADE approach that focuses the analysis on two elements:
- The evaluation of direct estimates.
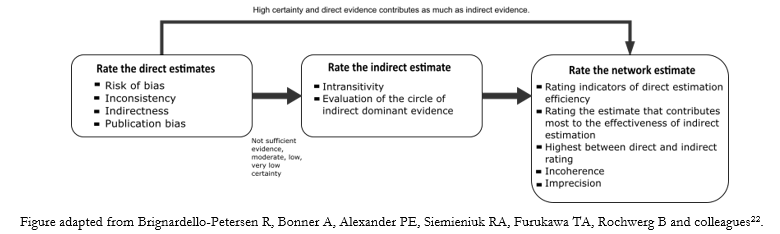
- In the evaluation of the indirect estimates, whose results condition the evaluation of the estimates of the network as a whole (Figure 5) [22].
As shown in Figure 5, the GRADE working group does not currently include evaluating the imprecision of direct estimates [22], unlike other working groups that include this, based on the common GRADE evaluation framework [15].
 Full size
 The analysis of the quality of evidence from network meta-analyses is complex, in which the practical usefulness of the meta-analysis ultimately depends. Therefore, there are numerous working groups seeking to refine and develop tools for the assessment of the quality of evidence from network meta-analyses [23],[24] and the disposition of the actual results [25].
Conclusions
Network meta-analyses, also called meta-analyses of multiple interventions, are a form of evidence synthesis that allows maximizing the use of available information, especially when multiple interventions are available for a single condition. This type of meta-analysis allows combining direct evidence (arising from direct comparisons) and indirect evidence from the comparisons included in the network, which is called mixed evidence.
Because of these peculiarities, network meta-analyses provide an avenue of analysis with "more background" for those who need to decide between multiple interventions. In addition, they seek to maximize the extraction of information from the currently available evidence. However, for their estimates to be valid and consistent, it is essential to assess the clinical and methodological homogeneity of the included studies. Finally, it is also necessary to evaluate the presence of systematic differences when extracting indirect evidence.
