Published on 22 de junio de 2026 | http://doi.org/10.5867/medwave.2026.05.3191
Mechanistic analysis of COVID-19 cases in Chile during the second half of 2020: an SIR model with dynamic transmission rate
The left-hand side shows model simulations obtained by shifting the optimal values of the parameters µmax and Vmax’ by 50%, compared with the observed data. On the right are the likelihood profiles based on the RMSE for µmax (top) and Vmax’ (bottom), where the red vertical line indicates the estimated optimal value for each parameter.
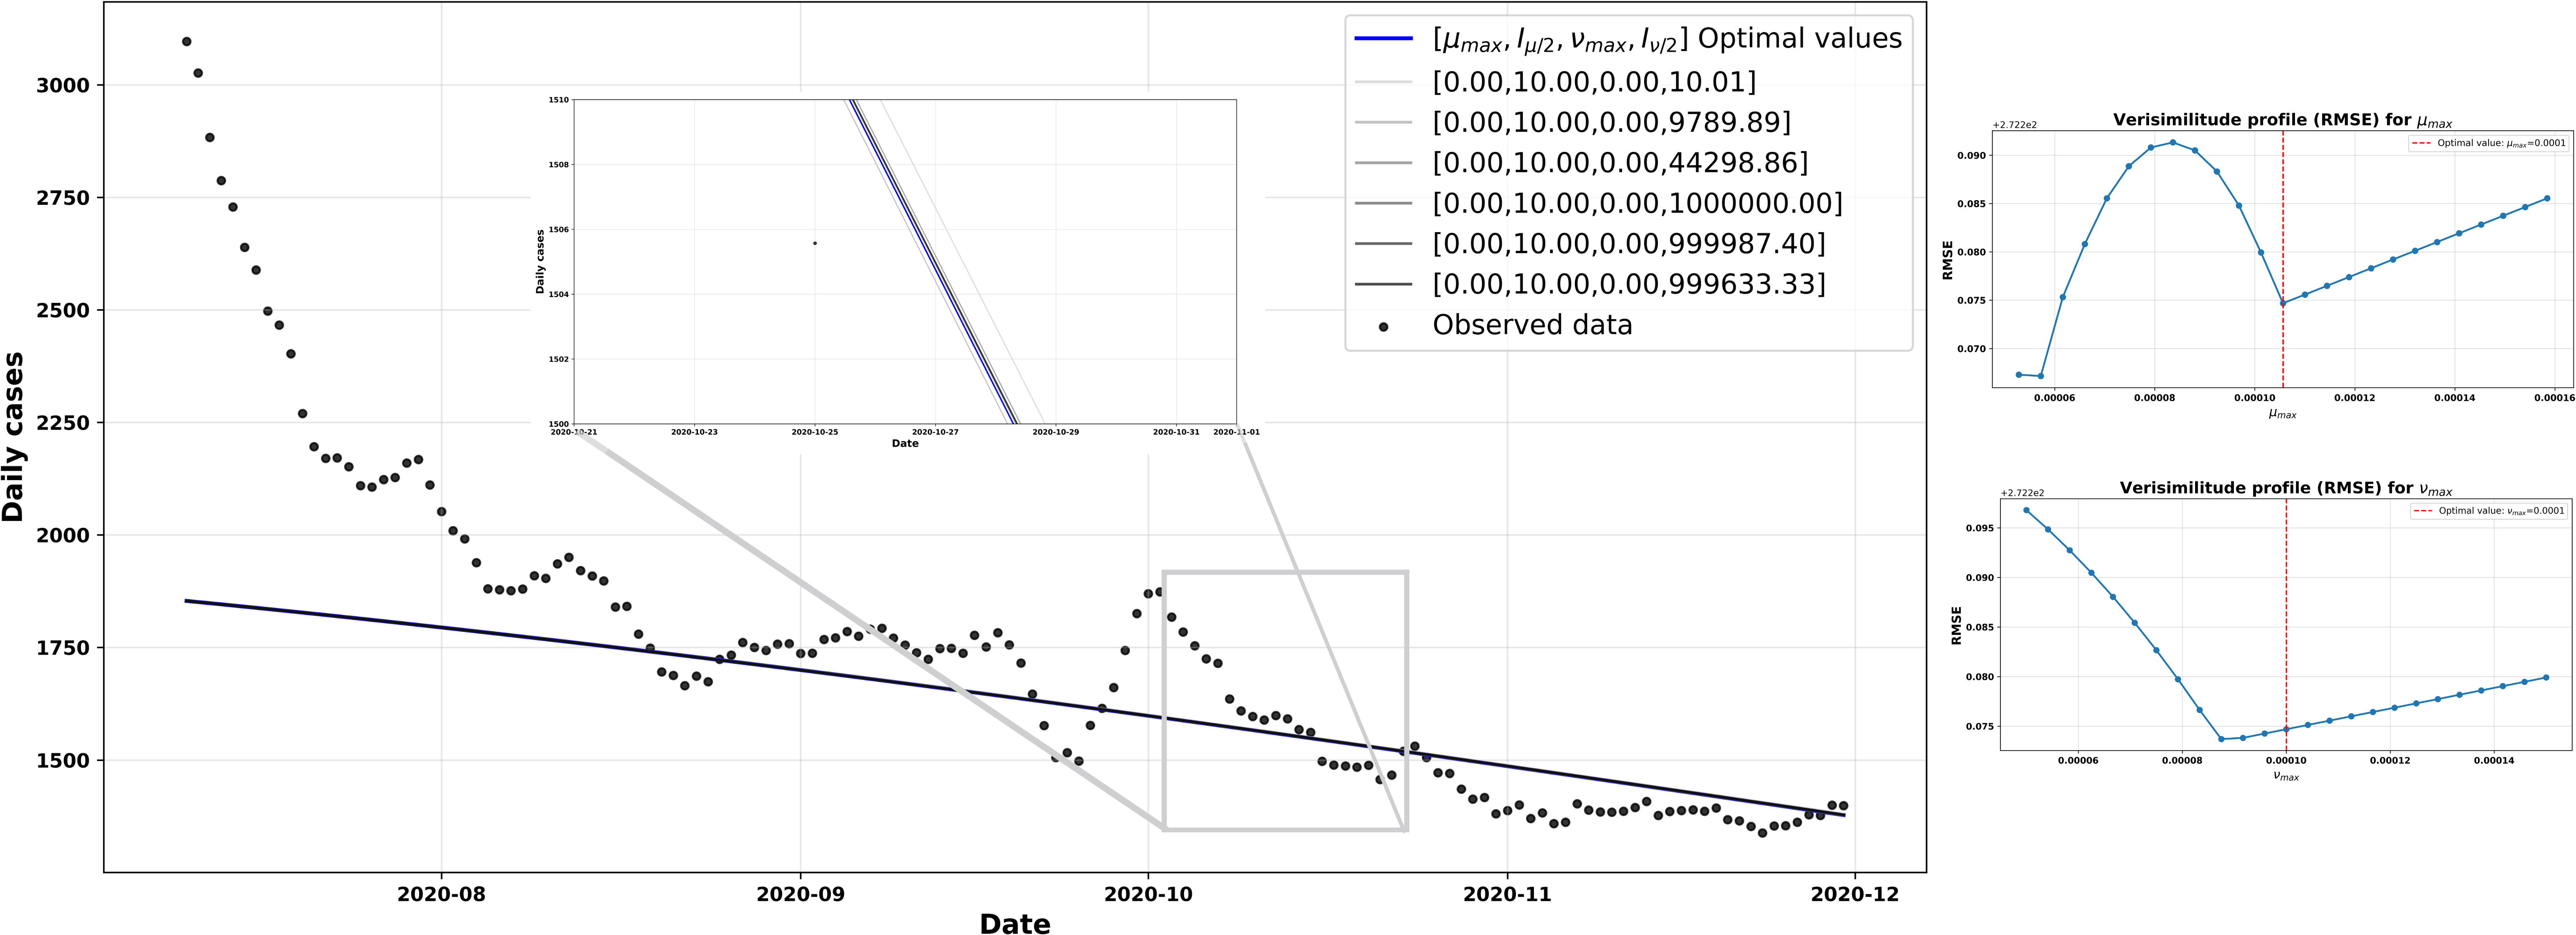
RMSE: root mean square error.
Source: Prepared by the authors of this study.
Source: Prepared by the authors of this study.