Research papers
← vista completaPublished on July 28, 2023 | http://doi.org/10.5867/medwave.2023.06.2682
Efficiency and productivity of the Chilean public health system between 2010 and 2019
Evolución de la eficiencia y la productividad del sistema de salud público chileno entre 2010 y 2019
Abstract
Introduction In view of the strong increase in health expenditure, it is necessary to investigate whether proportional increases in healthcare production for the beneficiaries of the National Health Fund have corresponded to this increase.
Methods In this observational, descriptive, and retrospective longitudinal research, we estimate the technical efficiency of the National Health Services System through the average cost of production and average labor productivity in the period from 2010 to 2019.
Results During the studied decade, production has increased by approximately 6% annually; the number of workers increased (mostly physicians) by 61%; spending on salaries increased by 106% in real terms; spending on consumer goods and services has increased by 25% in real terms; the efficiency of spending has decreased by 21%, and productivity is the least dynamic element of the system with an average annual growth rate of 0.6%. After subtracting the diagnostic tests component, this scenario worsens.
Conclusions The results show that higher health expenditure has not been matched by commensurate increases in output, translating into a fall in the efficiency of healthcare expenditure and meager increases or falls in productivity, depending on how the output is measured. This means that the public sector's growth strategy depends mainly on increases in the number of workers. This low productivity is a serious constraint to improving healthcare access for National Health Fund beneficiaries and contributes to increasing waiting lists. Special attention should be paid to average production costs and average labor productivity in a scenario of less dynamic growth in public health spending and health system reform.
Main messages
- In this article, we present the evolution of different expenditure components and synthetic indicators on the production of health benefits in Chile between 2010 and 2019.
- This work contributes with estimates on technical efficiency and average labor productivity in health.
- Among others, the limitations of this research are the heterogeneity of the data and the measurement of labor productivity, which does not incorporate variations in the capital stock of the National Health Services System.
Introduction
The growing demand for health care due to the aging population, the increase in chronic diseases [1], problems in access to medicines, and compliance with the deadlines of explicit health care guarantees have led to sharp increases in spending.
In Chile, public healthcare expenditure has recently increased [2]. Total health expenditure quadrupled between 2000 and 2019 at an average annual rate of 7.6%. This increase occurred as a result of the growth in expenditure by the National Health Fund (FONASA) (8.9% average annual rate) and the system of social security health institutions (ISAPRE) (4.9% average annual rate). National Health Fund expenditures increased fivefold in real terms, while in the social security health institutions system, they grew 2.5 times [3]. The share of health expenditure in the government budget increased from 11.4% in 2000 to 21.0% in 2019. In parallel, health spending has grown more than the gross domestic product (GDP), generating that health expenses, expressed as a percentage of GDP, have increased from 7% in 2000 to 9.1% in 2018, higher than the average of 8.8% of the countries of the Organization for Economic Cooperation and Development (OECD) [4].
It is possible that, given the economic effect of the coronavirus pandemic and the crisis caused by the war in Ukraine, coupled with the increase in Chile’s public debt, the fiscal space to continue sustaining the growth of public health expenditure will be reduced in the future [5]. Considering that out-of-pocket spending on health in Chile is one of the highest in the OECD and, given the difficulties in making the sources of financing more flexible (fiscal contribution or health contributions), the sector will depend to a greater extent on the efficient use of its resources [6,7].
In this article, we explore whether the financial effort in public health has been accompanied by proportional increases in the volume of care provided to National Health Fund beneficiaries by the National Health Services System (SNSS) and whether the public sector has made efficient use of these increased resources, measuring technical efficiency.
Methods
In this article, we measure technical efficiency. Microeconomically, technical efficiency is the optimal combination of factors or productive resources (e.g., physician labor, non-physician labor, infrastructure, equipment, clinical supplies, drugs, etc.) to provide health care [8]. One of the ways to measure technical efficiency is through the average cost of providing care. In other words, for a given mix of care, the most efficient allocation of factors will be that which minimizes the cost of production. The cost of production for a specific technology is given mainly by two sets of variables:
-
The price of the productive factors (e.g., remunerations, price of capital, price of drugs and inputs, etc.).
-
The productivity of these factors, i.e., the capacity of the system to transform productive resources into care or production (e.g., return on assets such as beds or wards, labor productivity, etc.) [9].
Methodologically, we worked with the expenditure efficiency approach, extending the approach of Rodriguez and Tokman [10], based on the formulation:

IEGi is an index of expenditure efficiency in year i; IVPi is an index of production value in year i; and IGSi is an index of health expenditure in year i. IVPi is the ratio of the output value in year i to the output value in the base year. It is possible to write IVPi as,

Where P and X are benefit vectors. Pb represents the price of the benefits charged in the base year; Xi is the number of benefits charged in year i; Xb is the number of benefits charged in the base year. MAI refers to the institutional care modality, while MLE is the free-choice modality from the National Health Fund.
IGSi is the ratio between health expenditure in year i and health expenditure in the base year. Health spending in year i is equivalent to a vector of factor prices (W) multiplied by a vector of physical factor contracting (L). This is estimated by aggregating the different components of expenditure: personnel, consumer goods and services of the institutional care modality of the health services, municipal transfers to primary care, and the free-choice modality.
This work measured sector efficiency based on the evolution of average production costs but extends Rodriguez and Tokman’s approach by separating out the effect attributable to changes in productivity; this study did not consider the free-choice modality. For this purpose, the ratio between the value of production and health spending was rewritten as follows. Health expenditure is represented by its main component, i.e. the volume of contracted factors (L) valued at the contracting price (W), i.e. (W*L). Thus, the ratio between production and health expenditure value would be: (P*X)/(W*L). We can interpret this ratio as the product of the price ratio between benefits and factors (P/W) and average labor productivity (X/L), i.e., (P/W)*(X/L). This allows us to differentiate the evolution of the average productivity of the system from the evolution of the price ratio of benefits with respect to factor cost.
To estimate the average costs of the National Health Services System and labor productivity, it was necessary to construct a production index to obtain a yearly comparable production. This was done using the aggregate activity index (IAAC) of the Chilean Ministry of Health (MINSAL), which allows the conversion of each year’s production into equivalent production units. The aggregate activity index determines the relative weight of each benefit group in the institutional care modality fee schedule for a base year (2013 was used as the base year in this work) and then weights each year’s care production based on this relative weight [11]. The production data were obtained from the monthly statistical summaries (REM), which are publicly available on the website of the Department of Health Statistics and Information (DEIS) of the Ministry of Health [12]. These data were extracted and transformed into tables using the pandas' analysis library version 1.5.3 and Python programming language version 3.7 [13].
To estimate the work units, we converted the staffing levels of laws 15 076, 18 834, 19 664, and experimental establishments into equivalent hours per week. For this purpose, 28 hours per week were considered for Law 15 076 and 44 hours per week for Law 18 834. In the case of experimental establishments, they were prorated proportionally among the other laws to associate them with this type of expenditure. The data were obtained from the Balances of Integral Management of the health services of the Budget Directorate of the Chilean Ministry of Finance. For comparative purposes, all values were transformed and expressed in constant currency, that is, in the value of Chilean pesos for 2020, adjusted by the general consumer price index (CPI). This work took data from public sources and therefore did not require approval by an ethics committee.
Results
Table 1 shows the evolution of the National Health Services System’s production from 2010 to 2019, with the weighting calculated according to growth estimates based on the 2013 production mix. Aggregate production has increased 67.3%, at an average annual rate of 5.9%, from 11.3 million benefits in equivalent production units in 2010 to 18.9 million in 2019. The largest increase in production occurred in the group of benefits corresponding to diagnostic tests (an increase of 80.9% and average annual growth of 6.8%). The smallest increase occurred in the closed care group, with 8.3% accumulated in the period (average annual growth of 0.9%). In this group, the decrease in hospitalizations in intermediate treatment and intensive care units stood out, with a cumulative drop of 26.2% and 17.4%, respectively. The growth in surgical interventions was 23.8% accumulated in the period (average annual growth of 2.4%).
Table 2 shows the evolution of the staffing of the National Health Services System, according to the type of contract and expressed in hours. Staffing levels increased by 59% in nine years. The largest increase was observed in the physician staffing under Law 19.664, with an increase of 94.1%, while experimental facilities only showed an increase of 24% in the period.
Table 3 shows that total spending on salaries increased by 102.4% between 2010 and 2019. The main drivers were: physician personnel, with an average annual growth rate of 9.9%; variable remunerations (fees, substitutions, extraordinary work, among others) with 9.7%; spending on consumer goods and services (drugs, clinical supplies, general expenses, etc.) with 9.2%; and non-physician personnel with 5.8%.
Table 4 and Figure 1 show some microeconomic indicators that help measure the efficiency of the National Health Services System’s expenditure for the analyzed period. The average operational cost of this system rose from $222 526 per equivalent unit of output in 2010 to $281 592 in 2019, i.e., a cumulative increase of 26.5% (average annual growth rate of 2.7%). This is because spending is growing faster on average (8.7% per year) than production (5.9% per year). In 2010, 4.5 equivalent production units were obtained for every million pesos spent. In 2019 for the same million pesos, 3.6 equivalent production units were obtained. In other words, the system’s capacity to convert resources into production or expenditure efficiency decreased by 21% from 2010 to 2019. What elements explain this drop in expenditure efficiency or the rise in average production costs?
Productivity and efficiency indicators evolution in the National Health Services System between 2010 and 2019.
Data shown as base index 2010 = 100, constructed by multiplying by 100 the quotient between the value of each indicator for year i and the value of the indicator for 2010.
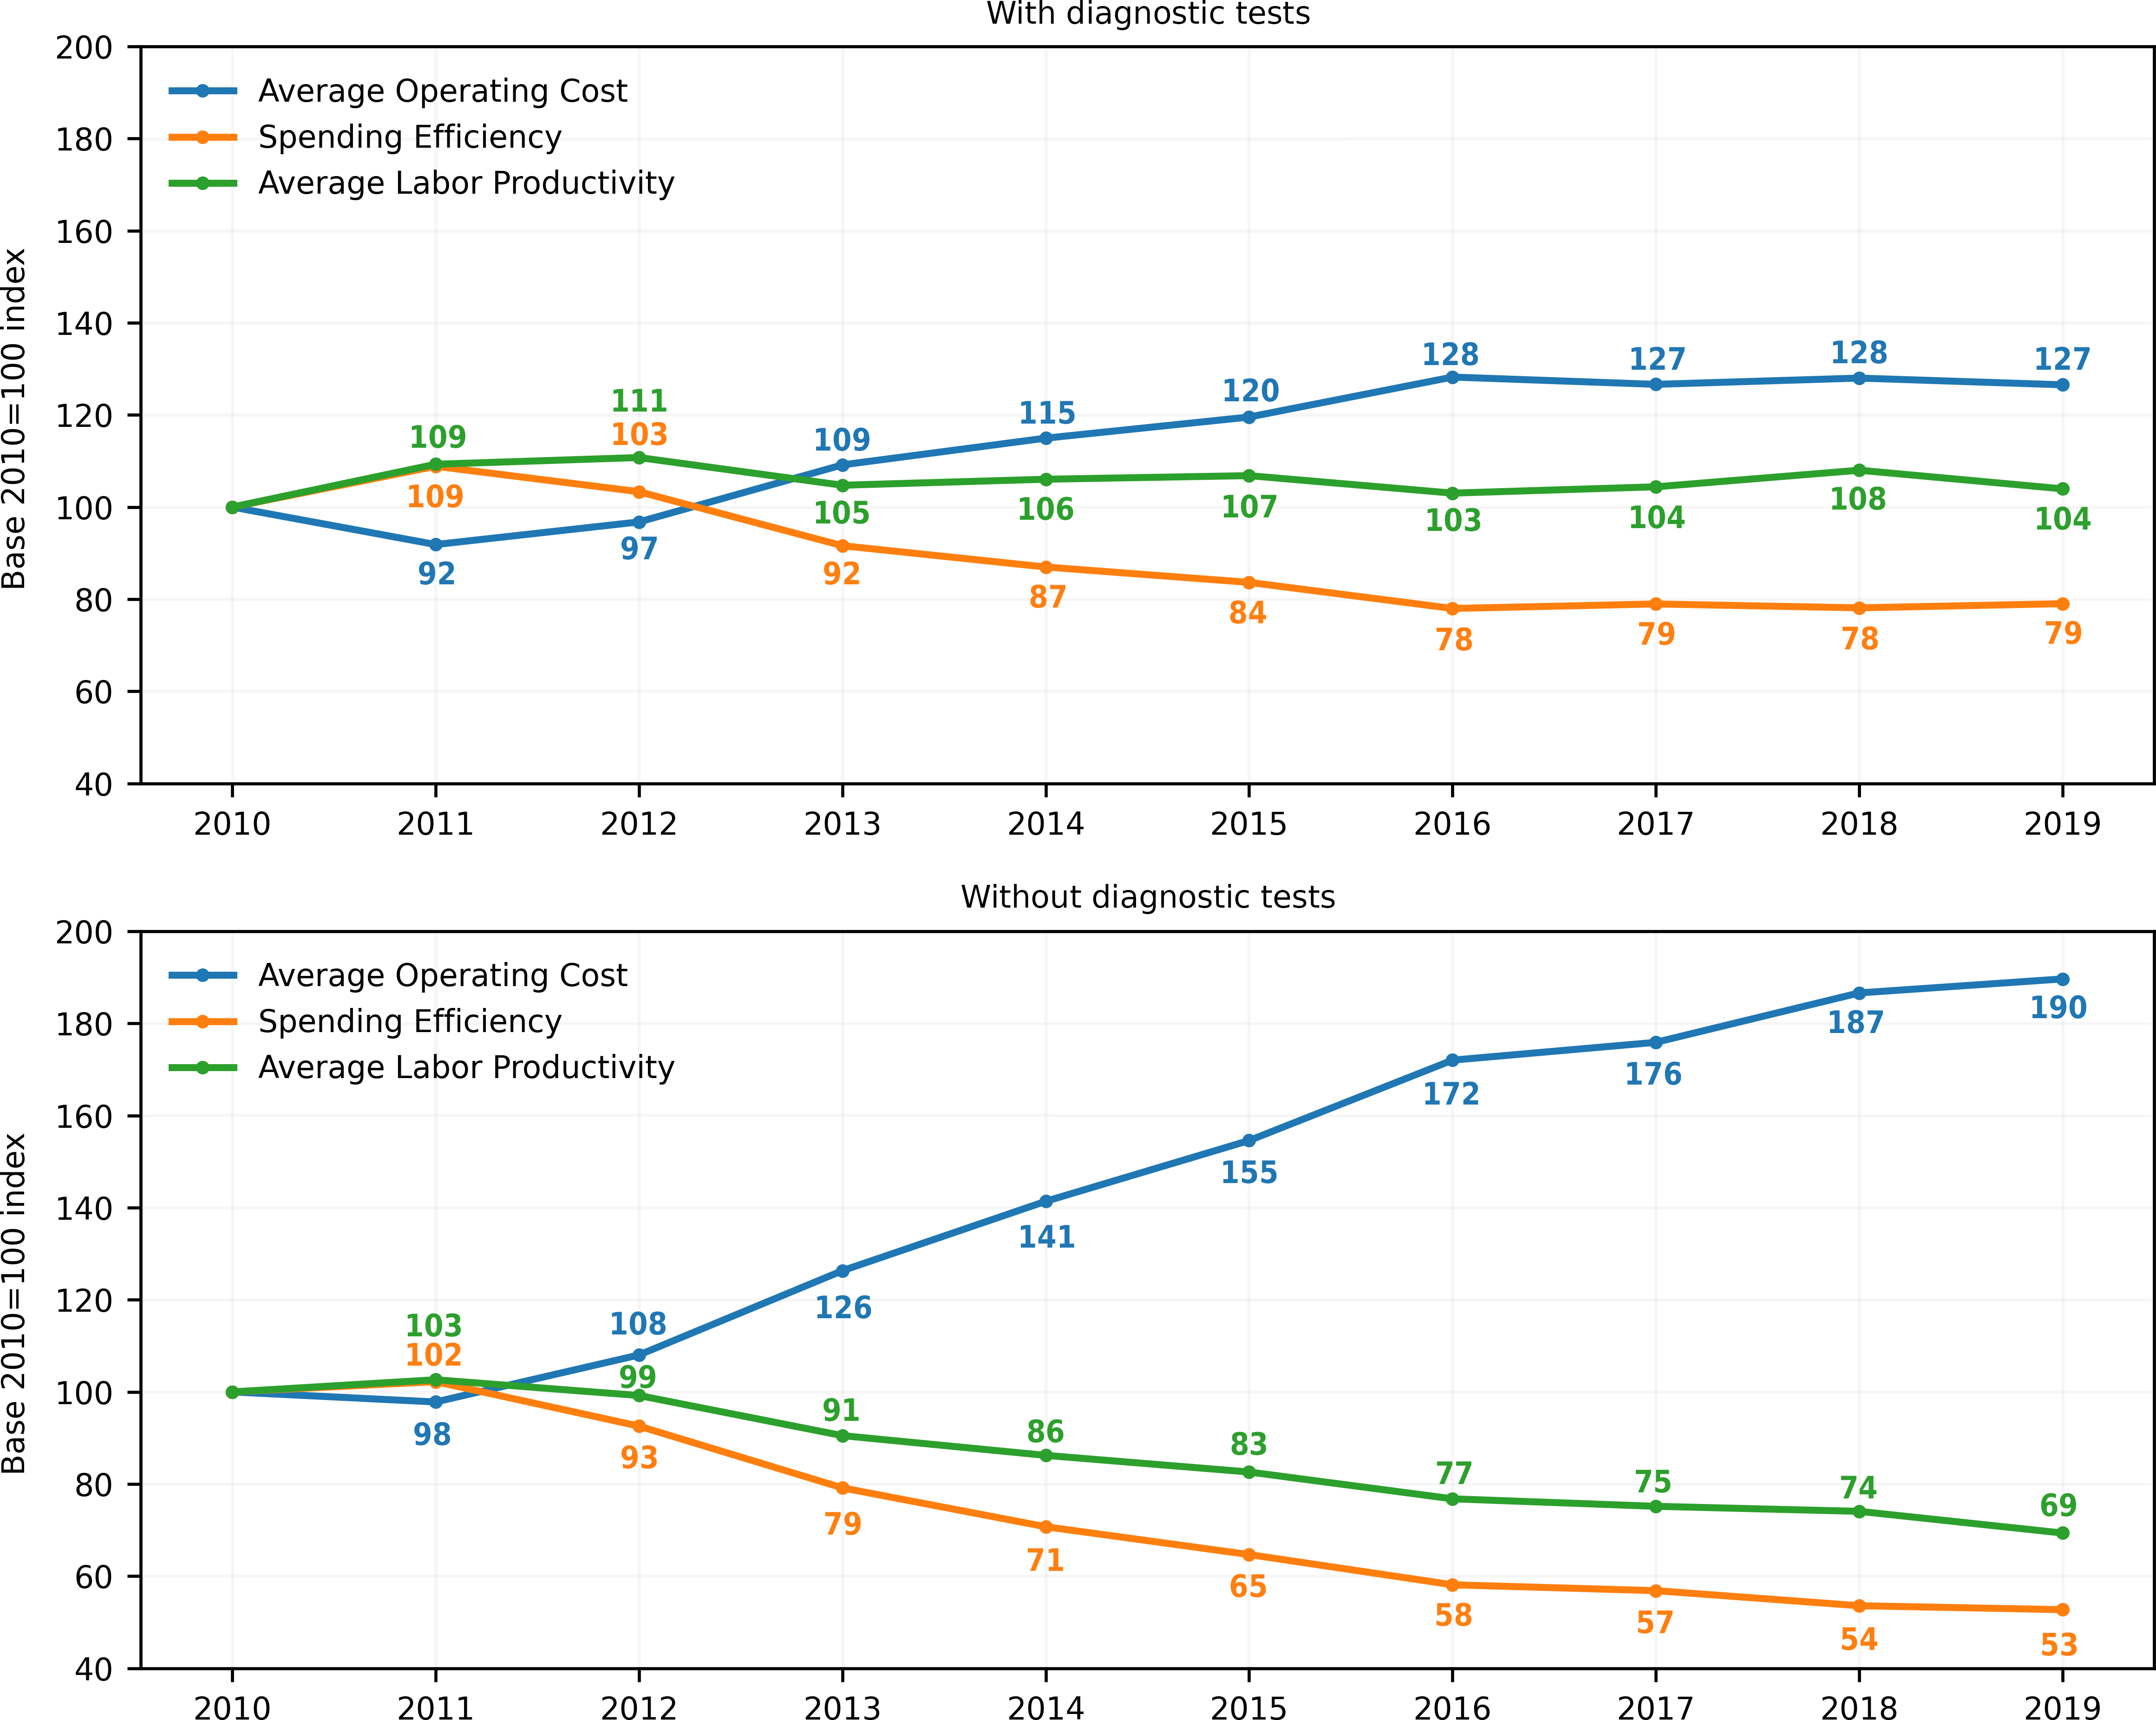
The increase in costs is explained, on the one hand, by the fact that production has grown mainly due to increased staffing levels. Total staffing grew 60.9% in the period under study (an annual average of 5.4%), mainly induced by the physician component, which grew by 87.2%, followed by 54.8% of the non-physician component (with an annual average of 7.2% and 5.0%, respectively). Simultaneously, real wages have been higher: average monthly remuneration grew by 25.8% with an annual average of 2.5%. The main driver of this has been the increase in physician wages (25.1%), followed by non-physician workers (7.1%). The average monthly physician salary in 2019 was three million pesos, for an average monthly non-physician remuneration of 893 thousand pesos, or 231.6% higher.
At the same time, it was observed that productivity is the least dynamic element of the system, contributing to a lesser extent to the production growth, with a 4% accumulated increase in the period and 0.4% average annual growth. In other words, the National Health Services System’s production growth strategy has relied mainly on hiring more personnel with higher real salaries each time.
Given that diagnostic tests can be considered as intermediate production (inputs) for final production (consultations, bed days, procedures, and surgical interventions), we subtracted the component of diagnostic tests (clinical laboratory tests, imaging, and pathological anatomy) from the production growth to see what has happened to final production under this definition. It is observed that production in the observed period grew much less: 11.6%, with an average rate of 1.2% per year. Spending efficiency falls from 1.2 benefits for every $1.0 million pesos spent in 2010 to 0.6 benefits (a 47.3% drop at an average annual rate of -6.9%). Under this productive definition, productivity falls from 34.4 benefits per worker per year in 2010 to 23.8 in 2019. This means a cumulative drop of -30.6% at an average annual rate of -4.0% (unpublished data).
Discussion
The results of this study show that higher health expenditure has not been accompanied by a proportional increase in output (measured through production expressed in equivalent units of benefits). This translates into a drop in the efficiency of health expenditure, between -21.0% and -47.3% from 2010 to 2019, depending on how the output was measured. Additionally, it is interesting to note that the average costs of the National Health Services System increased progressively in the observed period, between 26.5% and 89.7% depending on how the output was measured.
In the case of the methodology proposed by Rodriguez and Tokman, since prices are fixed in the 1999 tariff of the National Health Fund, and factor prices are not fixed in the same base year, the real increases in factor prices are included in the efficiency measure. For this reason, the measure can be associated with the inverse of the average cost of production. It should be noted that there was a correspondence between the expenditure efficiency index proposed by Rodriguez and Tokman [10] and the estimates of the average cost of sectoral production in this study. In both methodologies, an equivalent production was constructed, which could subsequently be related to health spending. In particular, expenditure efficiency corresponds to the inverse of the average sectoral production cost index.
These results are consistent with other research on the Chilean public hospital system’s efficiency, which shows similar trends. Since the mid-1990s, the efficiency of healthcare expenditure has been a controversial matter. The way to measure it in Chile has adopted two main approaches: efficiency of healthcare expenditure and Data Envelopment Analysis (DEA). Rodriguez developed a methodological proposal taking as an efficiency indicator the ratio between the value of production and healthcare expenditure [10]. This study concluded that the performance of spending between 1990 and 1999 fell by about 59%. In the data envelopment analysis, an efficiency frontier is constructed, and then the performance of the rest of the productive units is compared with this frontier, determining the existing levels of inefficiency [14]. Using this method, Castro concluded that public hospitals, on average, require between 30 and 94% more resources than necessary to generate a certain level of output [15]. Barahona-Urbina, with data from 1997 to 2006 from 190 hospitals, using a data envelopment analysis, concluded that Chilean regional hospitals should reduce their inputs by 10% to reach the efficiency frontier [16]. Santelices, also using a data envelopment analysis, considered 28 hospitals between May and October 2011, taking the expenses adjusted by diagnosis-related groups (DRGs) as outputs and as inputs the availability of beds, the number of personnel, and consumption of goods and services. This work found levels of inefficiency that ranged between 20 and 23.3%. In other words, production could be increased by 20% if hospitals became efficient [17]. In more recent work, Henríquez, also using the related groups by diagnosis, calculated equivalent average expenses adjusted by complexity at the hospital level according to complexity clusters and volume of operational expenditure executed in 2019. These estimates allowed him to point out the existence of gaps in expenditure between hospitals ranging from 3% to 93% between more efficient and less efficient facilities. He concluded that there was room for savings in hospital spending of between $91 billion and 235 billion pesos per year (between 129 and 334 million dollars), which would represent between 4.5% and 11.6% of the total annual expenditure on closed care in the hospitals under analysis [18]. The National Productivity Commission developed an extensive study on the inefficiency of using elective operating rooms in public hospitals, estimating an average cost per surgery of $3 000 higher than the $1 800 dollars of the United Kingdom’s National Health System. This cost is partly explained by the use of wards. In Chile, this use is of 4.9 hours (54.4%) versus 6.4 (71.1%) in the United Kingdom, both in relation to 9-hour availability [19]. Barahona et al. explored wards' performance for elective surgery, highlighting that in 2019 it was 2.5 surgeries, while in 2018, 2020, and 2021 the performance was around two surgeries per ward available for elective surgery, concluding that there is inefficiency in the use of wards [20].
Additionally, our work gives new background, providing estimates on the evolution of average labor productivity in Chilean public hospitals, which was estimated from 4% to -30.6% (depending on how the output was measured, with or without diagnostic tests) from 2010 to 2019.
Three aspects are noteworthy from the perspective of the sector’s financial aggregates. First, the low average labor productivity indicates that the sectoral production growth strategy (in the face of an in-crescendo demand due to the aging and increasing chronic conditions of the Chilean population) has been through the expansion of labor contracting. Second, low productivity and rising salaries have generated pressure on the average production costs of the Chilean public hospital system, adding to the growth of expenditures on consumer goods and services. Third, the reduction in expenditure efficiency means that for every million real pesos spent in the health sector, lower production levels have been obtained throughout the studied period.
Given the budgetary restrictions faced by the Chilean State, it is unlikely that the rate of increase in health expenditure observed from 2010 to 2019 will continue. These arise due to the higher expenditure generated by the Covid-19 pandemic, citizen demands, and the economic crisis that underlies the pandemic, to which a more belligerent scenario at the international level has contributed to an increase in inflation and interest rates. A more restrictive financial scenario will force a review of the production growth strategy based mainly on increasing the number of workers. Given the meager productivity growth, the hospital production growth rate will likely decline if corrective measures are not taken in a lower-growth financial scenario.
In this context, given that the demographic and epidemiological component of demand will continue its upward trend and with a moderately growing production of care, without prejudice to the achievements obtained through public health policies aimed at major changes, such as interventions aimed at nutrition and reducing the consumption of harmful substances such as tobacco and alcohol, it is very likely that in the future there will be greater pressure on public waiting lists [20,21,22].
A key element in the future will be to develop strategies to boost the low-productivity growth rate. This variable allows simultaneous production increases and wage improvements beyond budgetary increases. If sectoral productivity does not improve, sustaining wage increases will be more difficult.
One of the strategies that have gained strong momentum in recent years since its incorporation in the 2020 Budget Law is the extension of the payment mechanism by diagnosis-related groups by the National Health Fund to finance 65 hospitals of greater complexity in the public system. This policy generates a system of counting the activity of hospitals on a common basis (associated with clinical measures of complexity) that allows better comparability between the facilities' activity. In addition, it makes it possible to better reimburse the complexity of cases attended by hospitals. Although this strategy can be improved by improving registration systems, the cost of diagnosis-related groups, and the system of incentives associated with the payment mechanism, it is a step in the right direction in terms of generating a system for monitoring hospital activity, which will have to be complemented by monitoring productivity.
Although measuring the efficiency and productivity evolution is critical, it is not enough and must be accompanied by measures to improve clinical and administrative management. In this field, the next healthcare system administrations should contemplate two major sets of measures. First, generating a more robust incentive system that strengthens the link between health outcomes, production, and production costs is necessary. This implies that the National Health Fund should continue strengthening its payment mechanisms for public supply and that new forms of organization should be explored in parallel. Specifically, the discussion should move towards hospitals or healthcare services as state-owned public companies, with a new, more flexible salary and labor contracting regime. The work of physicians and other health workers must be reorganized, generating clearer incentives for organizations and their workers to move towards work schemes focused on health outcomes for patients or the population, productivity, and innovation.
Second, a strategy for improving care processes must be promoted at the level of the service networks and within the hospital production units. This implies improving clinical, administrative, and diagnostic-therapeutic support processes. Modern management techniques must be incorporated, strengthening information systems and providing space for clinical and management teams to propose innovative care formulas that improve productivity and health outcomes for their users. It is necessary to provide flexibility and support for innovation. At the same time, it is necessary to create human and technological capacities, supporting the education and training of personnel and managers. It is necessary to strengthen connections between the new public organizations and academia, with international organizations and the technology industry, patient associations, etc., to promote a flow of knowledge and experience.
The reform proposal of President Boric’s administration, which proposes a single healthcare system, must incorporate in its package of proposals clear and robust measures aimed at improving the productivity and productive efficiency of the National Health Services System if it is to prosper politically. It is likely that with the efficiency of the NHS spending down, and probably below that of the private system, it will be difficult politically to move in the proposed direction of a single-fund system. In other words, the efficiency and productivity of the National Health Services System are the "Achilles heel" of health reform.
There are several limitations and difficulties to consider when working with this approach using the methodology described above. Firstly, when constructing time series for a decade of analysis in an aggregate (national) context, it is inevitably observed that the mix of benefits (the volume of production and its composition) changes in parallel to the combination of factors (labor, capital) used to produce it. Therefore, it is impossible to identify the exact participation of such factors in the results (benefits) beyond the monetary volume they executed and their relation to production in the long run.
Secondly, the data show heterogeneity in databases from the same year and to a greater extent between different years, with respect to their format, benefit codes, number of variables collected, and inconsistent observations in some cases, in concomitance with outdated websites of public agencies. This made it necessary to conduct an exploratory and corrective analysis of the databases used. Examples of this are observations with null values, inconsistent values (total columns where the figure is less than the sum of its components), values in different formats (presence of thousands separator with comma and/or period, text in numerical columns), among others. These cases occur in a context where it is natural to observe the presence of random errors when each of the thousands of providers uploads its production directly to a centralized IT platform.
Another major limitation of this work is that it measures labor productivity without incorporating variations in the capital stock of the National Health Services System. The production level depends not only on employment but also on the amount of capital available for work. The implicit assumption in this paper is that the capital stock has remained relatively constant in the period under study. Measuring capital stock is complex, and there is no readily available information to undertake this task. While there are good reasons to assume a constant stock (such as the small variation in the number of available ward hours in the National Health Services System, corresponding to 1.9 million between 2010 and 2016), to determine labor productivity more accurately, it is necessary to incorporate this effect of variation in the capital stock in the future.
Conclusions
The results show that higher healthcare expenditure has not been accompanied by a proportional increase in production measured in equivalent units. This has translated into increases in the average production costs of the National Health Services System and a fall in the efficiency of public spending on health. The meager increases or decreases in productivity, depending on how it is measured, mean that the public sector’s growth strategy has depended mainly on increases in the number of workers. This low productivity is a serious constraint to improving access to healthcare for National Health Fund beneficiaries and contributes to increasing waiting lists.
Consequently, special attention should be paid to average production costs and average labor productivity in a scenario of less dynamic growth in public health spending and health system reform.
